A benchmark is a sensor
The simple mental picture
A simple mental picture we have for an AI capability benchmark is to think of it as a sensor with a certain sensitivity within a certain range of capabilities. The sensitivity of a benchmark, i.e. it’s ability to distinguish the capability of different models, is given by a curve like this:
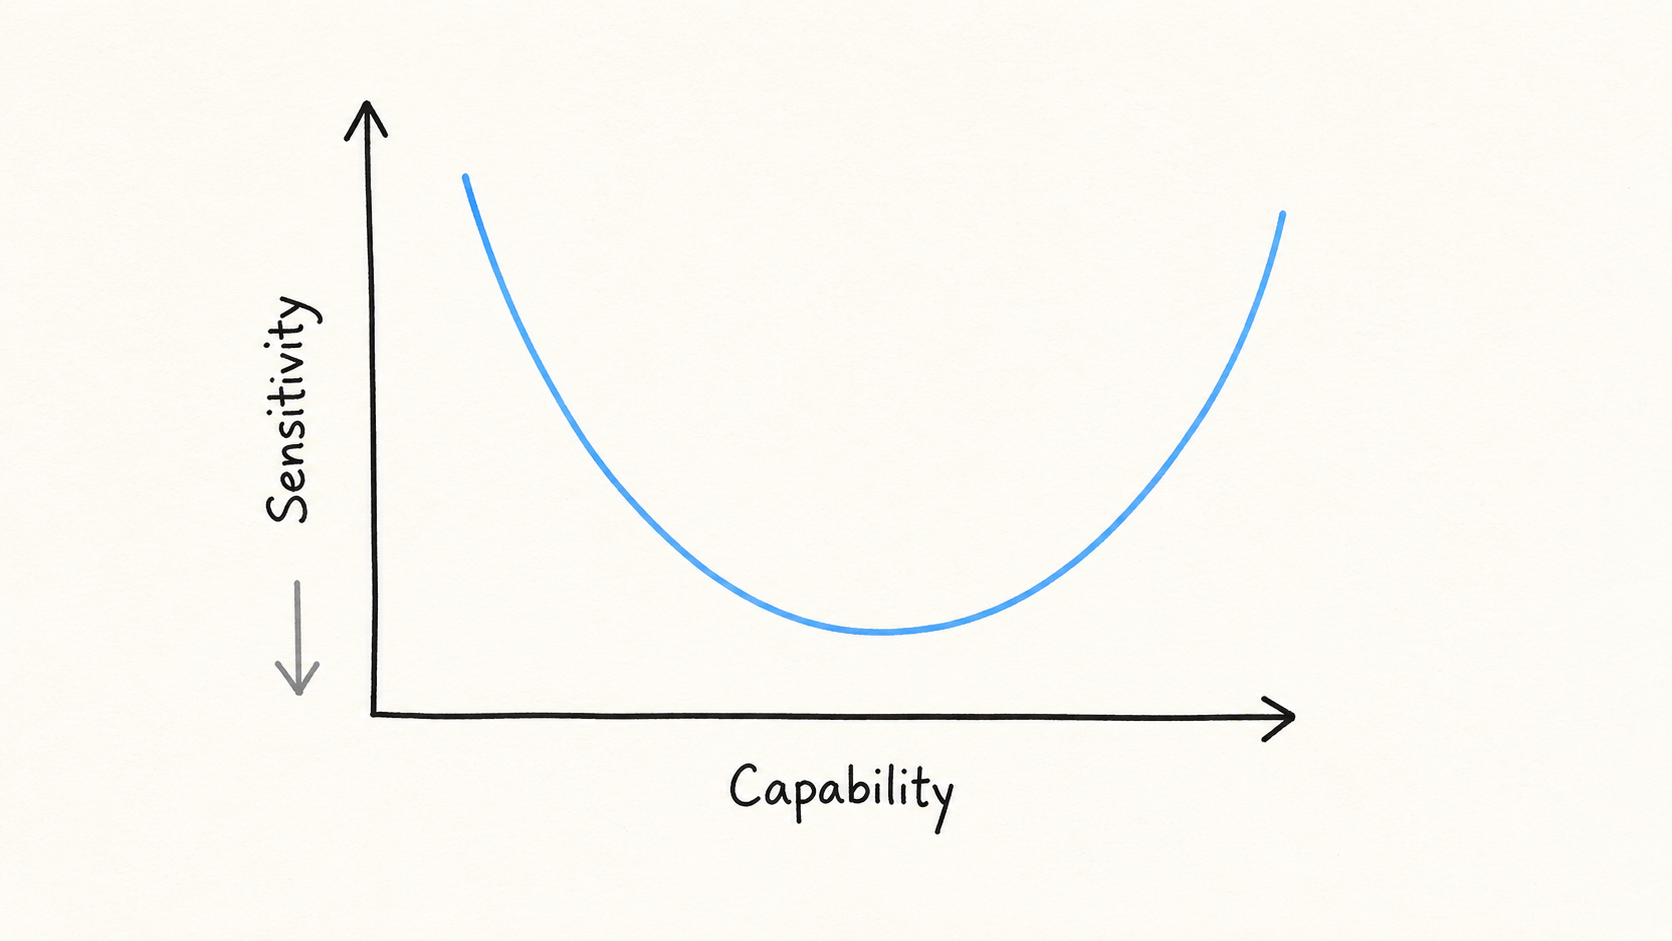
The curve starts high (low sensitivity, high uncertainty), since for models with low capability all the tasks in the benchmark are too hard, and the benchmark can’t distinguish between low and very low capability. Similarly all the tasks are too easy for a very capable model, and we lose the ability to differentiate again. In between is the range of capabilities the benchmark is sensitive to, and the sensitivity curve tells you how easy it is to distinguish small capability differences between models at different overall capability levels.
A good benchmark is very sensitive over a long range of capabilities, but there is a tradeoff. Say you want to make a benchmark with 1000 questions. You could make the questions all have roughly the same difficulty. That would make you very sensitive to capabilities close to that difficulty, but you would only be sensitive in this narrow range. However, if you make the questions have very different difficulty, you get some sensitivity to a wide range of capabilities, but you have very few questions at each specific capability level, so your results will be noisy (low sensitivity). Increasing the number of questions will make you more sensitive across the board.
A benchmark will generally have different sensitivity to different capabilities, so SWE-Bench Pro will be more sensitive to agentic coding capability, and less (although still somewhat) sensitive to, say, math capability.
Epoch Capability Index (ECI) as a toy model
The ECI maps any specific benchmark into a common index using a sigmoid transformation
where is the benchmark performance (from 0 to 1), is a sigmoid, is the slope, is the capability of the model and is the difficulty of the benchmark. The difficulty, , tells you the capability level with the most sensitivity, and the slope, , tells you how wide a range of capabilities you are sensitive to. A large slope means you are sensitive in a very narrow capability window, while a small slope means you are sensitive to a wide range of capabilities. In order to complete our toy model we add a noise term assumed to be Gaussian with a benchmark-specific constant standard deviation. This noise term tells us how much actual benchmark scores scatter around the score predicted by the models’ capability (as measured by ECI). The noise sets the overall sensitivity of the benchmark, low noise -> high sensitivity. We now have a simple 3-parameter model to specify the full sensitivity curve of a benchmark to a capability index like ECI.
If you then tell me how well a model does on a given benchmark, I can tell you (assuming we know the slope, difficulty and noise level for that benchmark) what the model’s ECI-score will be (with a certain precision), and this precision is the sensitivity of the benchmark!
Using Epochs public code for estimating the ECI (github) we can plot the sensitivity curves for a selection of benchmarks.

ECI sensitivity plots for a few selected public benchmarks for a range of model capabilities. The higher the value, the higher the uncertainty (lower sensitivity).
Here we have used the residuals (data – model) to estimate the noise level of each benchmark, then divide by the derivative of the sigmoid to convert this noise-level to the corresponding uncertainty in ECI.
As an example, say someone tells you that GPT 5.6 scores 50% on FrontierMath T4 Private. Our toy model then gives a precise estimate for ECI of 161.6 0.75. However, if someone tells you that GPT 6 scores 95%, then the model estimates 176 4. The increase in uncertainty is because the benchmark is getting saturated, and is less sensitive to such high capabilities.

Lines: The predicted performance on each benchmark as a function of model capability. Dots: Real model performances on each benchmark as reported by Epoch.
Take the specific curves here with a huge grain of salt, since they depend on the very simplified assumptions in our toy model. In particular, while the sigmoid curve fits pretty well for the benchmarks we have looked at, the constant noise assumption is not very good at the tails of the sigmoids, where the variance tends to be lower than at the midpoint. So the toy model works best for benchmark scores in the middle range of the sigmoids.
Anyways, the details are not that important, what we want to get across is the simple mental picture: a benchmark score is a measurement with an implicit error bar in capability space, and the size of that bar depends on where the model sits on the benchmark’s sensitivity curve for that capability.