This is a blog/series on how to scale and evaluate a Vespa Application for serving enterprise-scale workloads and customer facing applications with potentially millions of users. Vespa is the AI search platform and all-in-one solution for all your retrieval and large scale computation needs.
In this blog I will show you how to feed a large dataset to a Vespa Application. We will be using the full MS_marco passages dataset, which is perhaps the most comprehensive open dataset for information retrieval. It is around 4GB and contains more than 8 million passages on a wide range of topics. The goal in this blog is to show how scaling works in Vespa through feeding the entire dataset as fast as we can.
Creating the Vespa Application
We will be using a pre-made sample application as our basis for scaling but the concepts are the same for any other application.
Setup:
-
Create a tenant on Vespa Cloud:
Go to console.vespa-cloud.com and create your tenant (unless you already have one).
- Install the Vespa CLI using Homebrew:
$ brew install vespa-cliWindows/No Homebrew? See the Vespa CLI page to download directly.
- Configure the Vespa client:
$ vespa config set target cloud $ vespa config set application your-tenant-name-here.scalingtutorial - Get Vespa Cloud control plane access:
$ vespa auth loginFollow the instructions from the command to authenticate.
- Clone the sample application:
$ vespa clone scaling-tutorial scaling-app && cd scaling-appThis sample app is perfect for demonstrating scaling and performance as it is quite intensive to run both for feeding and querying. You can also check out sample-apps for other sample apps you can clone.
- Add a certificate for data plane access to the application:
$ vespa auth certIt is a good idea to take note of the path to the .pem files written here.
-
Add the cross-encoder and Colbert model
Export the cross-encoder ranker model to onnx format using the Optimum library from HF or download an exported ONNX version of the model (like in this example)
$ mkdir -p models $ curl -L https://huggingface.co/Xenova/ms-marco-MiniLM-L-6-v2/resolve/main/onnx/model.onnx -o models/model.onnx $ curl -L https://huggingface.co/Xenova/ms-marco-MiniLM-L-6-v2/raw/main/tokenizer.json -o models/tokenizer.json -
Download the dataset
The msmarco passages dataset can be found here. Download, unzip it and place it in the
ext/folder in our application.NOTE: You will need around 8GB of free disk space for the dataset and the subsets we will be creating.
-
Prepare the dataset for Vespa
Then run the script to convert it into the vespa feed format:
$ python3 ext/transform_ms_marco.pywhich gives us the dataset and a few subsets of various sizes to feed to our application.
Deploying and Feeding
We now have everything we need for deployment, feeding and scaling! Scaling a vespa application is largely managed through the services.xml file. This is what the file currently looks like:
<?xml version="1.0" encoding="utf-8" ?>
<!-- Copyright Vespa.ai. Licensed under the terms of the Apache 2.0 license. See LICENSE in the project root. -->
<services version="1.0" xmlns:deploy="vespa" xmlns:preprocess="properties" minimum-required-vespa-version="8.311.28">

  <container id="default" version="1.0">

    <nodes deploy:environment="dev" count="1">
      <resources vcpu="1.0" memory="8Gb" architecture="arm64" storage-type="local" disk="59Gb"/>
    </nodes>

    <search/>
    <document-api/>

     <!-- See https://docs.vespa.ai/en/embedding.html#huggingface-embedder -->
    <component id="e5_embedding_model" type="hugging-face-embedder">
            <transformer-model url="https://huggingface.co/intfloat/e5-small-v2/resolve/main/model.onnx"/>
            <tokenizer-model url="https://huggingface.co/intfloat/e5-small-v2/raw/main/tokenizer.json"/>
            <prepend>
                <query>query:</query>
                <document>passage:</document>
            </prepend>
    </component>

    <!-- See https://docs.vespa.ai/en/embedding.html#colbert-embedder -->
    <component id="colbert_embedding_model" type="colbert-embedder">
      <transformer-model url="https://huggingface.co/colbert-ir/colbertv2.0/resolve/main/model.onnx"/>
      <tokenizer-model url="https://huggingface.co/colbert-ir/colbertv2.0/raw/main/tokenizer.json"/>
    </component>

     <!-- See https://docs.vespa.ai/en/reference/embedding-reference.html#huggingface-tokenizer-embedder-->
    <component id="tokenizer" type="hugging-face-tokenizer">
      <model path="models/tokenizer.json"/>
    </component>

  </container>

  <content id="msmarco" version="1.0">
    <min-redundancy>1</min-redundancy>
    <documents>
      <document mode="index" type="passage"/>
    </documents>
    <nodes deploy:environment="dev" count="1">
      <resources vcpu="1.0" memory="8Gb" architecture="arm64" storage-type="local" disk="59Gb"/>
    </nodes>
    <engine>
      <proton>
        <tuning>
          <searchnode>
            <requestthreads>
              <persearch>4</persearch>
            </requestthreads>
            <feeding>
              <concurrency>1.0</concurrency>
            </feeding>
          </searchnode>
        </tuning>
      </proton>
    </engine>
  </content>

</services>
The important parts to take note of in this tutorial are the two resource specifiers in the <container> and <content> tags:
Container
<nodes deploy:environment="dev" count="1">
    <resources vcpu="1.0" memory="8Gb" architecture="arm64" storage-type="local" disk="59Gb"/>
</nodes>
Content
<nodes deploy:environment="dev" count="1">
    <resources vcpu="1.0" memory="8Gb" architecture="arm64" storage-type="local" disk="59Gb"/>
</nodes>
This is where we configure the machine resources that our Vespa application runs on in Vespa Cloud.
NOTE: when deploying to dev we need to add the <nodes deploy:environment="dev"> specifier to ensure we actually get the resources we ask for,
otherwise we default to what is quickly available.
Adding more resources or more nodes are the main parameters that need to be tweaked in order to scale your application. Right now we have provisioned the smallest amount of resources to our application.
Deploy the application to Vespa Cloud:
$ vespa deploy --wait 900
(It might take a little bit of time for all services and nodes to go up and start running.)
You can follow the progress of the deployment from the terminal or in your tenant in your cloud console. When it is finished you should get the message:
Application up!
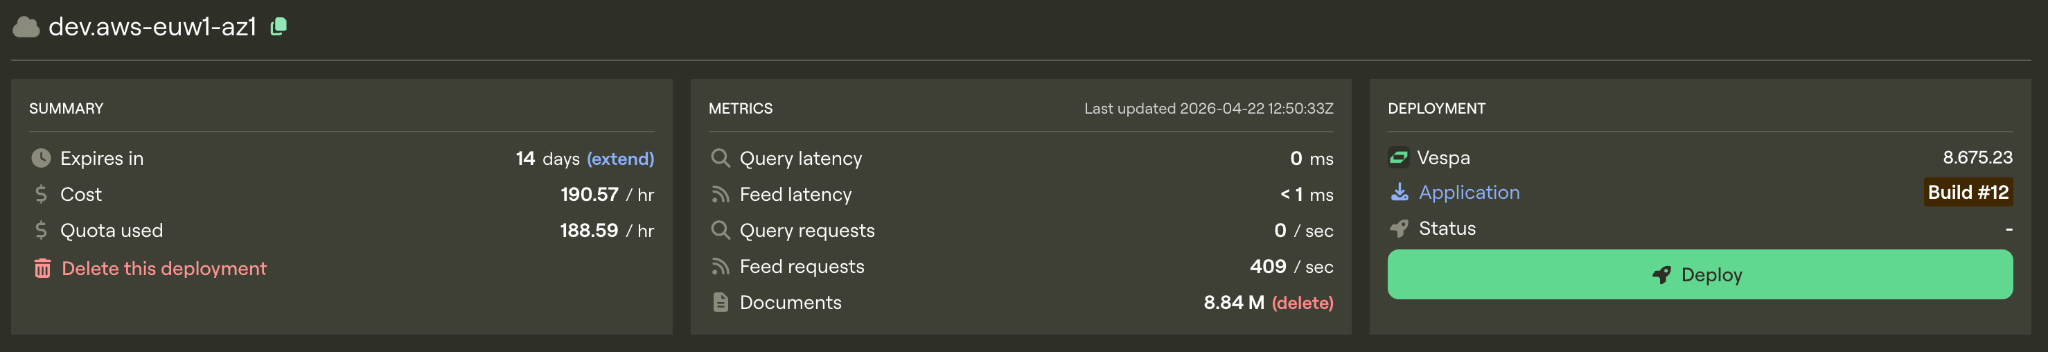
If you go to your cloud console you should be able to see your application. Note that we haven’t fed it any documents yet, so it should look something like this:
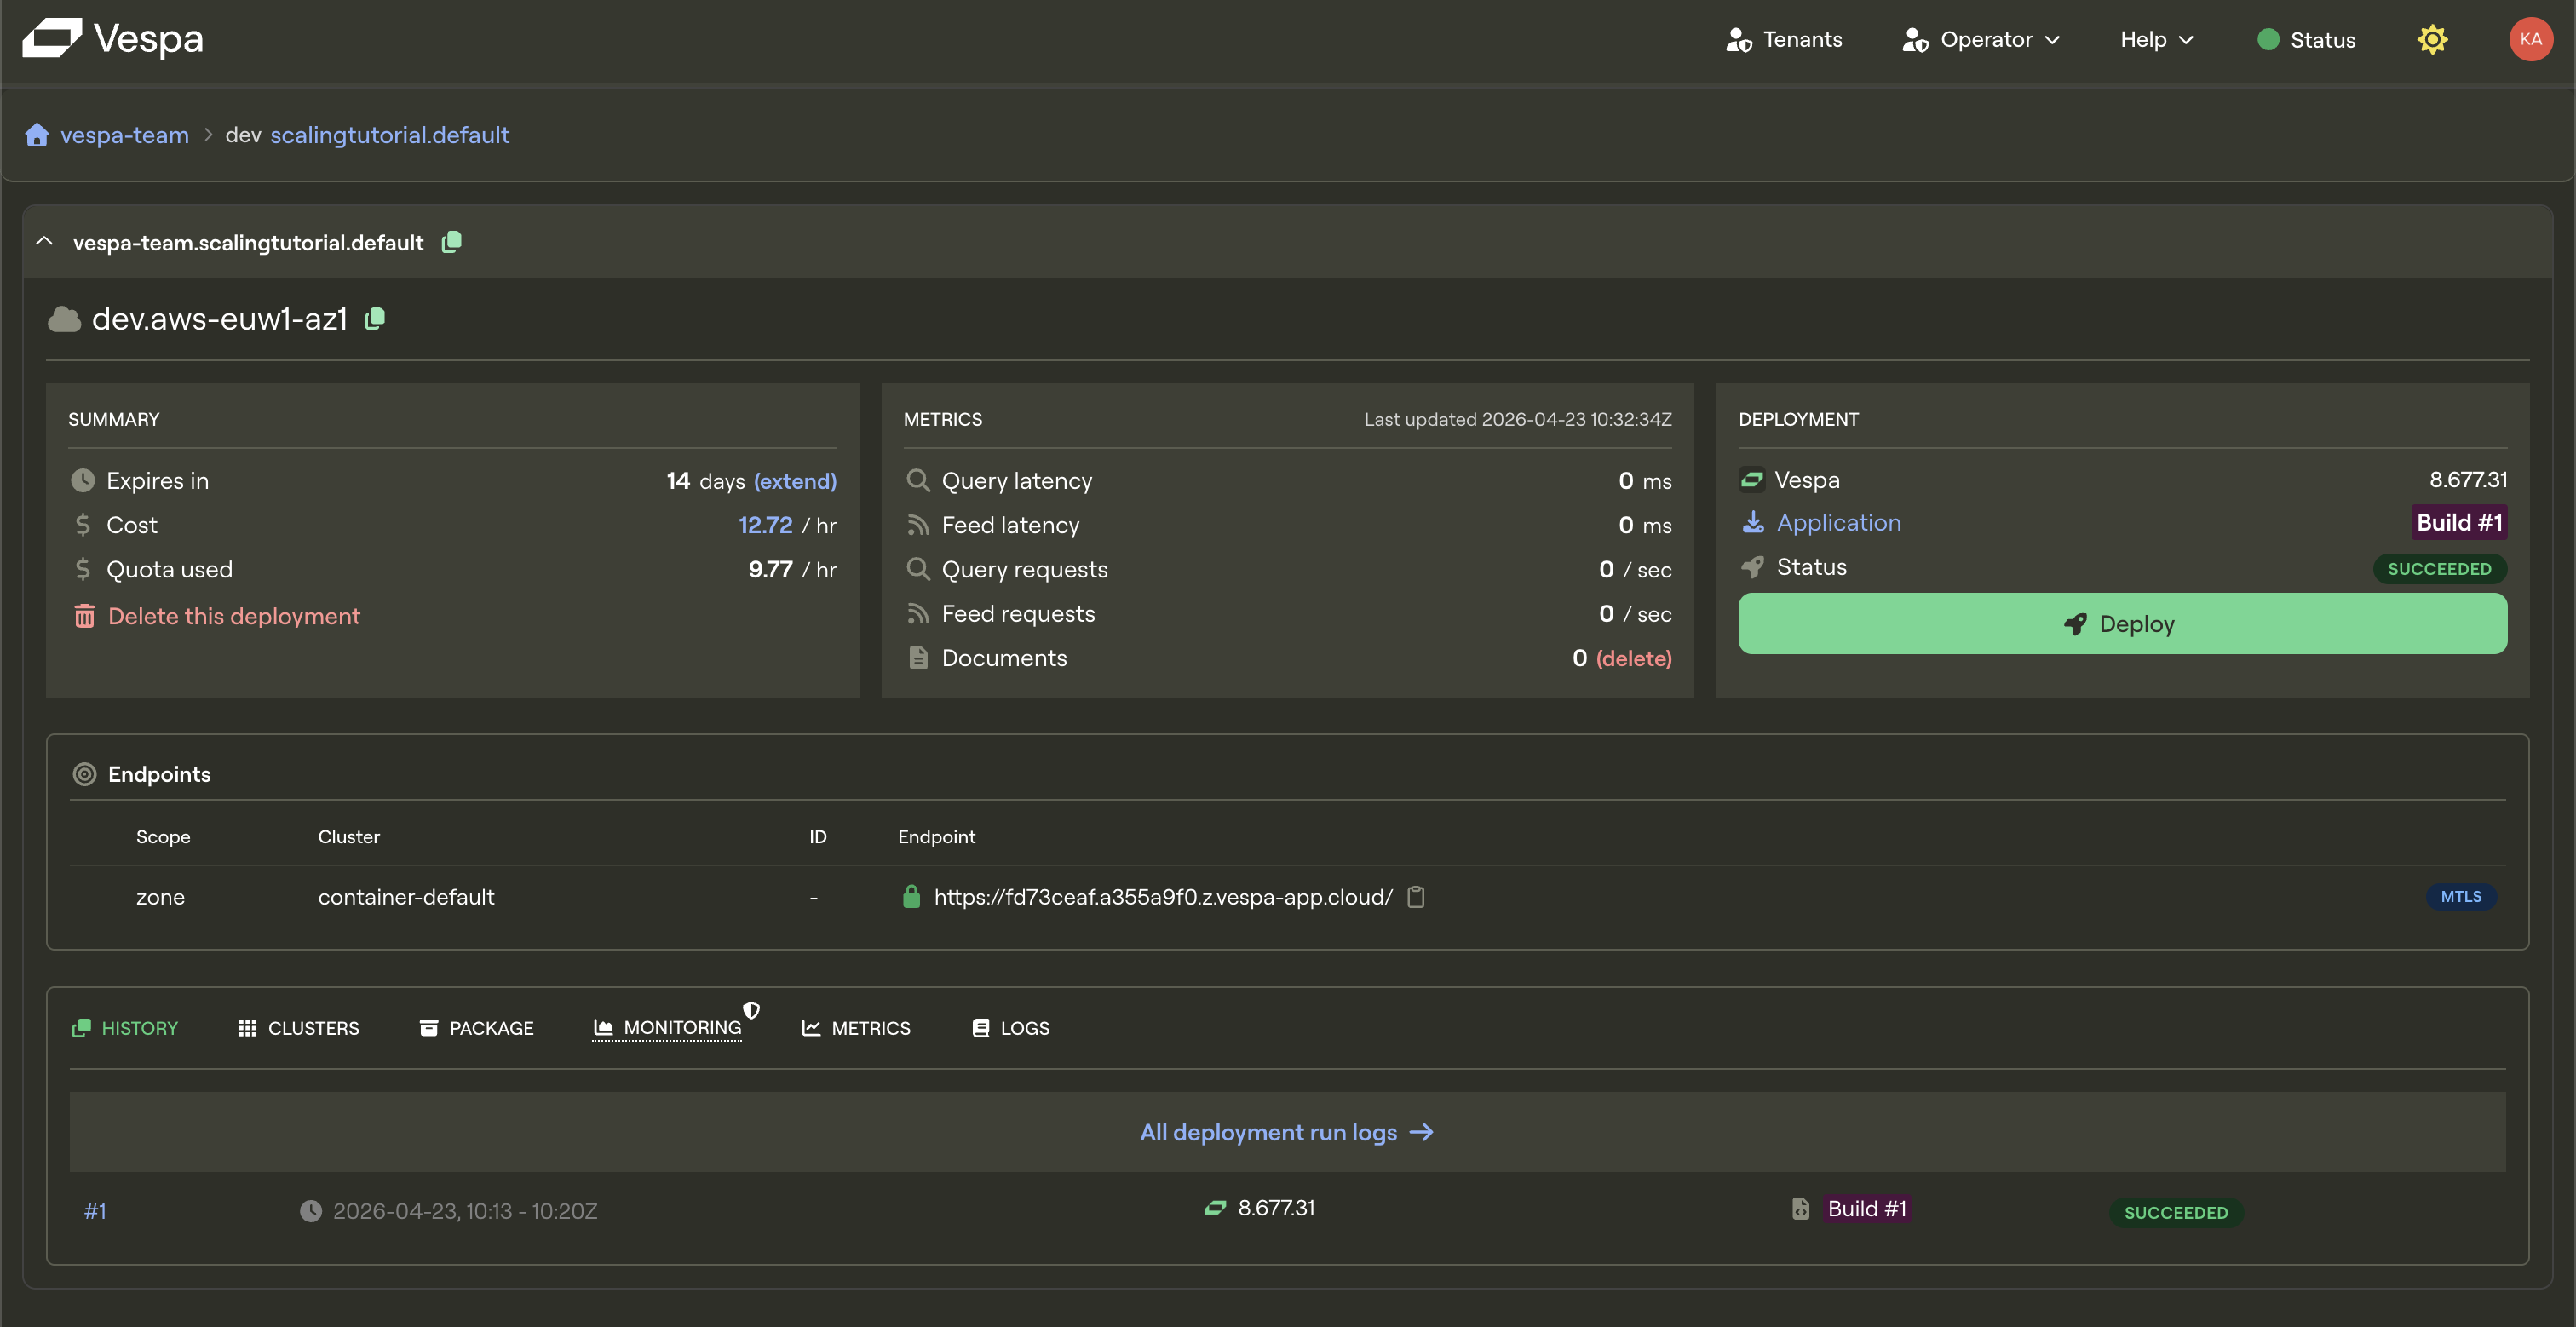
Let’s feed some documents. Feed the smallest dataset to Vespa using:
vespa feed ext/corpus_transformed_1000.jsonl
or, on Unix systems:
time vespa feed ext/corpus_transformed_1000.jsonl
to see how long it takes.
It will take a few minutes as we are doing heavy computations on very modest resources.
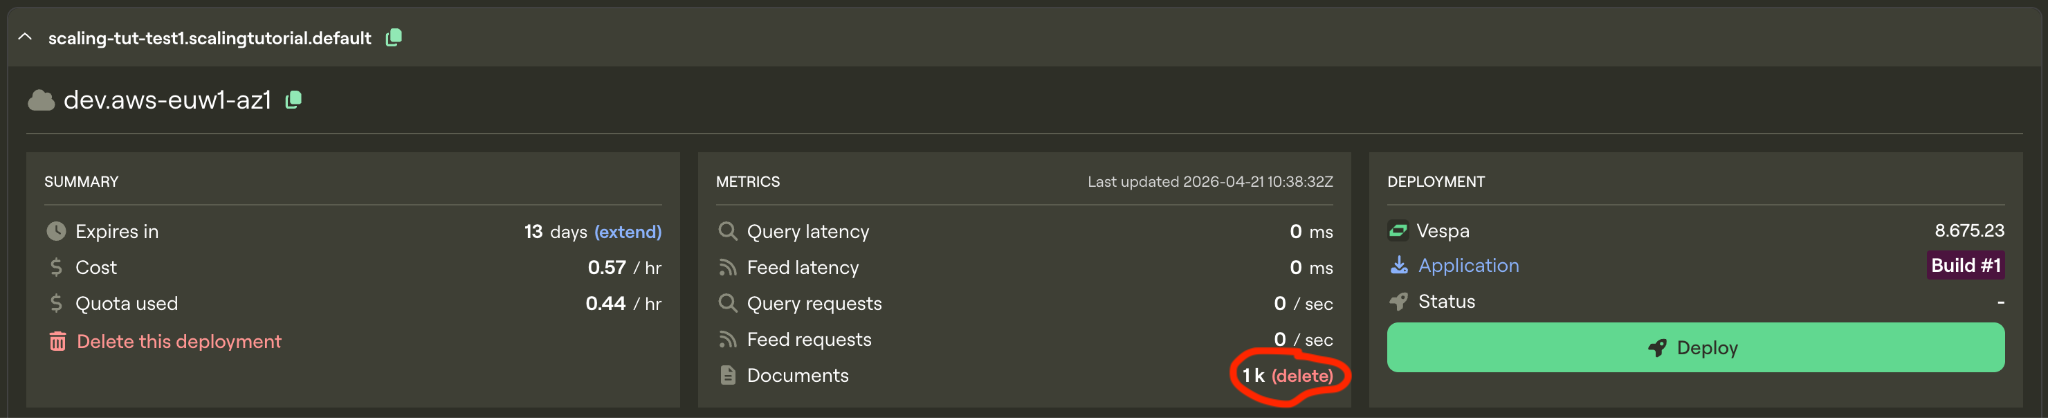
If you want to see a live count of how many documents that are in Vespa you can run:
vespa query 'yql=select * from passage where true' 'hits=0' 'ranking=unranked'
to see how many documents have been processed so far (under documents).
On this lowest resource configuration we get this result.
vespa feed ext/corpus_transformed_1000.jsonl 4.96s user 7.11s system 3% cpu 5:56.05 total
If we were to try and feed the whole 8.8 million passage msmarco dataset on this instance it would take more than a month to finish feeding!
We can do better!
Scaling
Before scaling the application we’ll delete the documents from our instance so that we have a fresh start.
Now lets assign more resources to our Vespa instance. From our schema we see that we are doing extensive computations during feeding (notice the configuration in the indexing parameters)
Schema
  field e5_embedding type tensor<bfloat16>(x[384]) {
    # Using the e5 embedding model defined in services.xml
    indexing: input text | embed e5_embedding_model | attribute | index
    attribute {
      distance-metric: angular
    }
    index { # override default hnsw settings
      hnsw {
        max-links-per-node: 32
        neighbors-to-explore-at-insert: 400
      }
    }
  }

  field colbert_embeddings type tensor<int8>(dt{}, x[16]) {
    # No index - used for ranking, not retrieval
    indexing: input text | embed colbert_embedding_model | attribute
    attribute: paged
  }
Embedding in Vespa happens in the container cluster, so it is a very reasonable guess that if we can make the embeddings go faster, our whole system will be faster (bellow in this blog we will show how to more thouroughly deduce scaling parameters). So lets start by scaling up the resources for the container node. To see what resource configurations we have available we must look at the instance type page in the documentation. Embedding-computations are best suited to run on GPUs, so we will select an instance type with a GPU:
Container
<nodes deploy:environment="dev" count="1">
    <resources vcpu="4.0" memory="16Gb" architecture="x86_64" storage-type="local" disk="125Gb">
        <gpu count="1" memory="16.0Gb"/>
    </resources>
</nodes>
Replace the resources in the container node in services.xml with the new instance type (see above). Leave the content node resources as is for now.
Run the command for checking document count to make sure that it is zero:
vespa query 'yql=select * from passage where true' 'hits=0' 'ranking=unranked'
and redeploy:
$ vespa deploy --wait 900
When the deployment is finished we’ll time the feeding process again.
time vespa feed ext/corpus_transformed_1000.jsonl
vespa feed ext/corpus_transformed_1000.jsonl 0.40s user 0.53s system 8% cpu 11.371 total
11.4 seconds, that’s more like it! Instead of a month, this new instance would be able to crunch through the full dataset in just around a day!
We have now significantly upgraded a part of the hardware Vespa is running on. But before we scale up further we shall take a look at the metrics tab for our application. Go to Metrics and then resources.
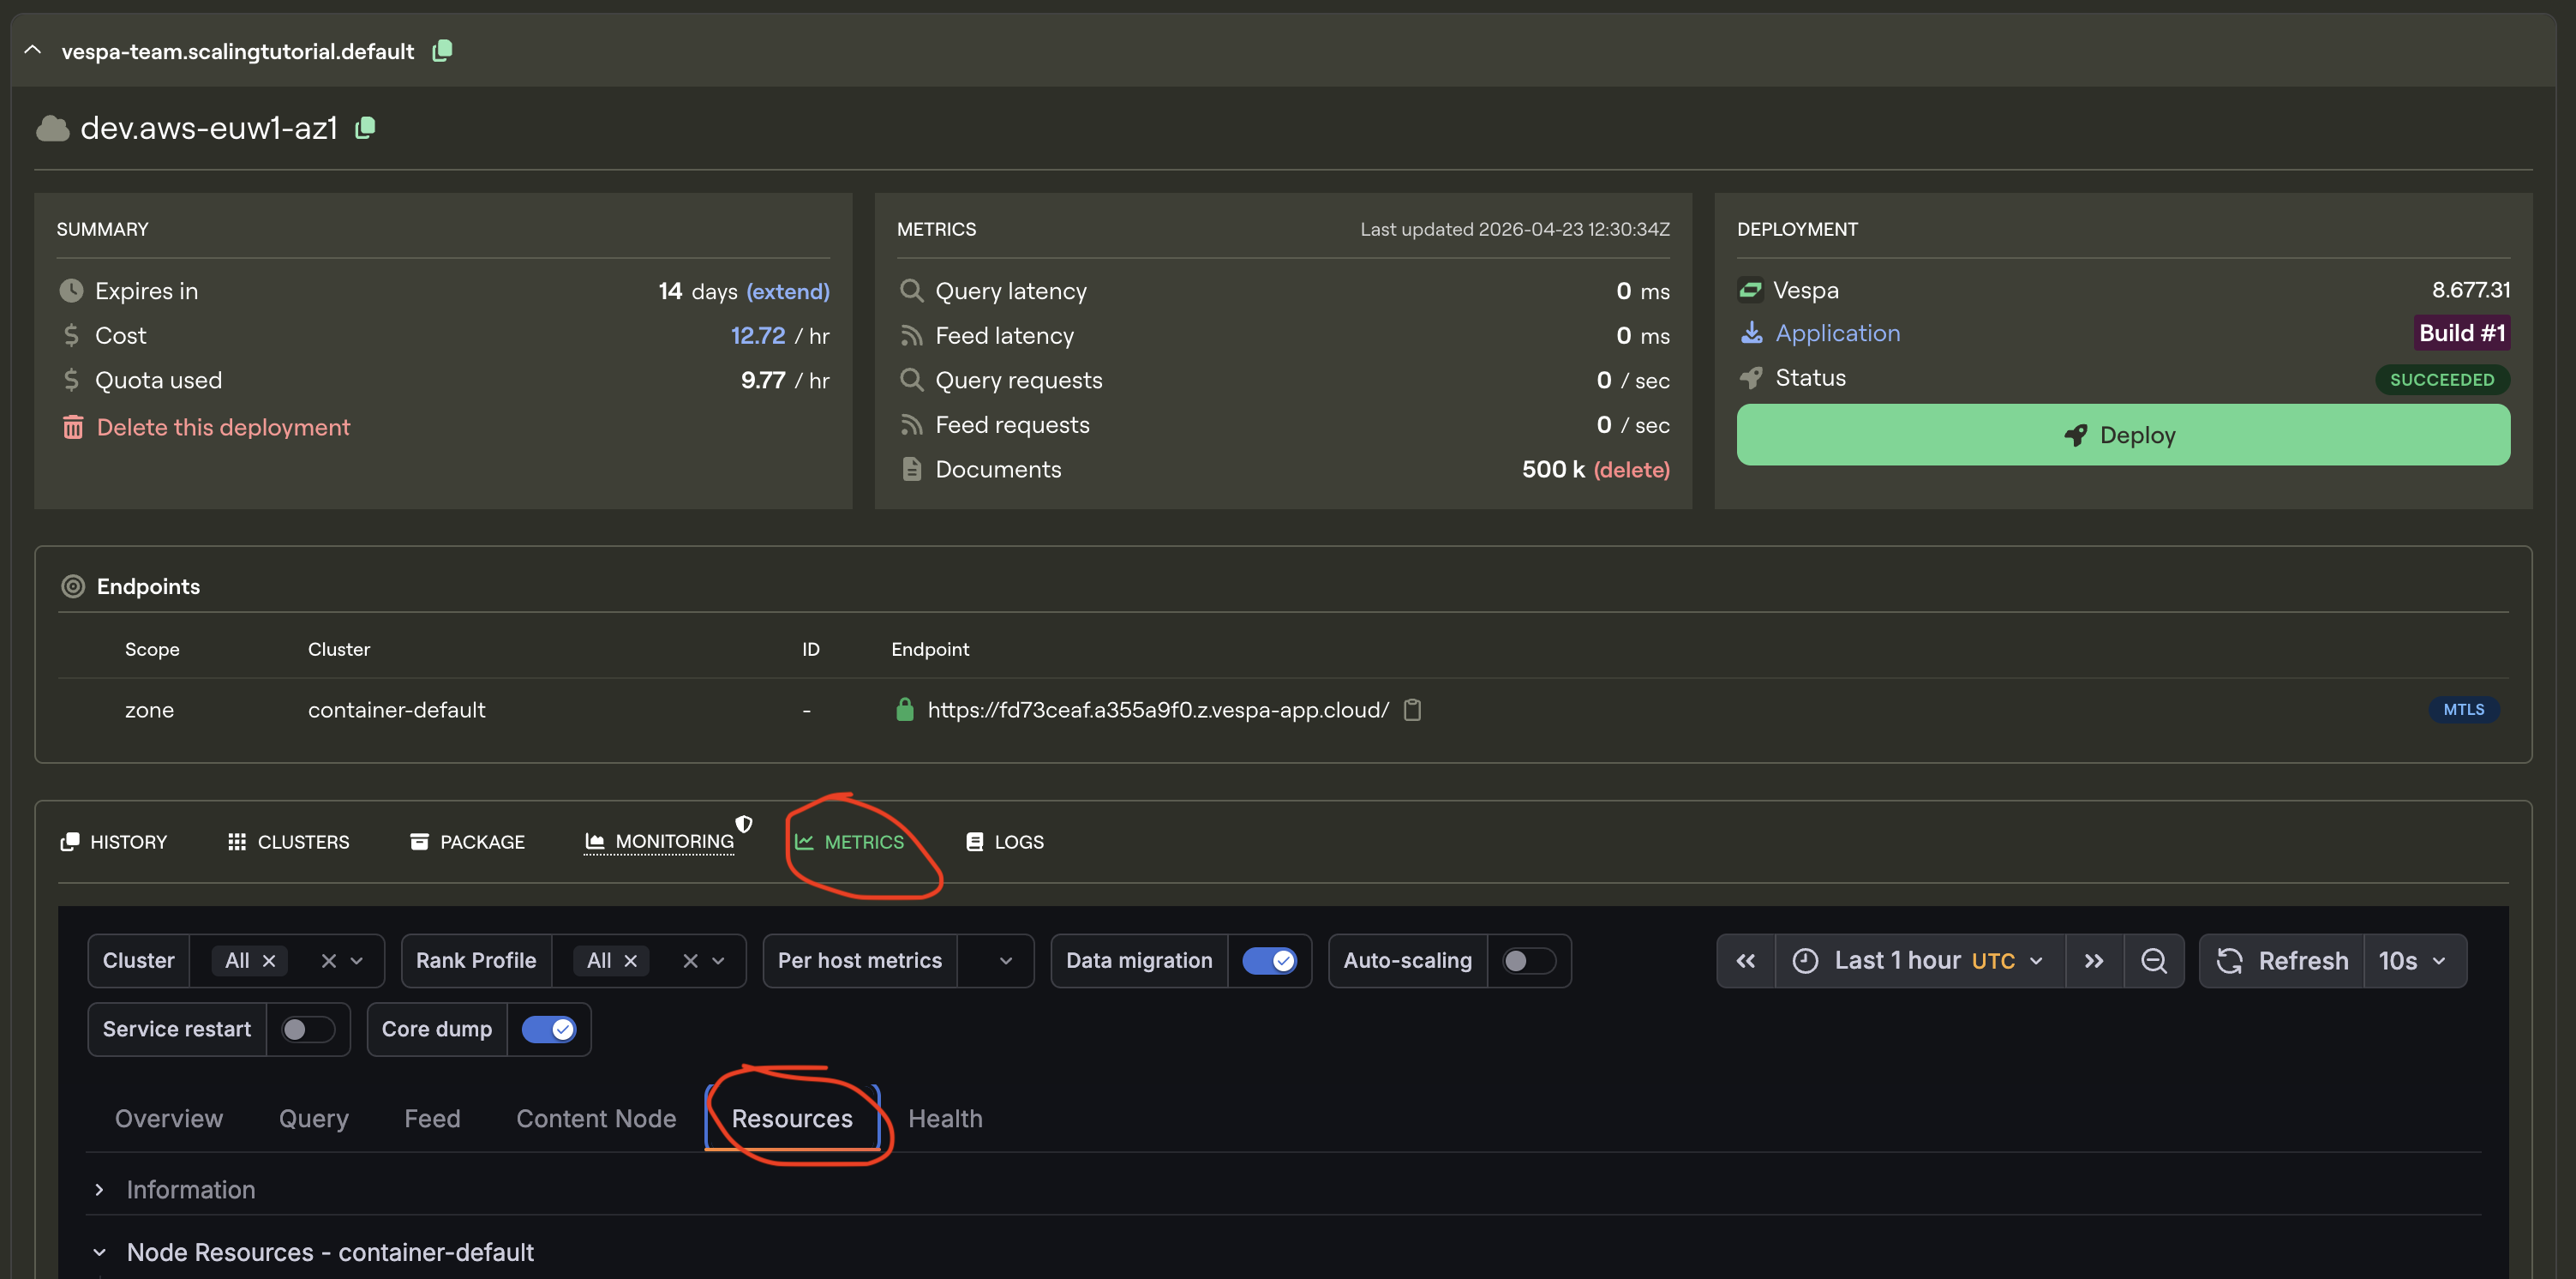
This is where you see the resource usage history in your vespa instance, but most importantly it gives you a clear image of where your application is bottlenecked. The bottleneck for your application will be different depending on how your application is configured and the kind of computations you do. The previous 1000-line dataset was no match for the upgraded instance, so lets give it a bigger one to get some proper bottleneck data:
Delete the documents from the instance again, wait a bit, and run the command to ensure that we have no documents in our application
vespa query 'yql=select * from passage where true' 'hits=0' 'ranking=unranked'
Now we’ll feed the 50 000 line dataset to properly test and time the upgraded instance.
time vespa feed ext/corpus_transformed_50000.jsonl
Result
vespa feed ext/corpus_transformed_50000.jsonl 17.44s user 22.68s system 11% cpu 5:56.41 total (~17.6 hours for full dataset)
This is a more accurate reading of the instance’s performance, and at 5min 56s to feed 50 000 documents, the full dataset would take around 17 and a half hours.
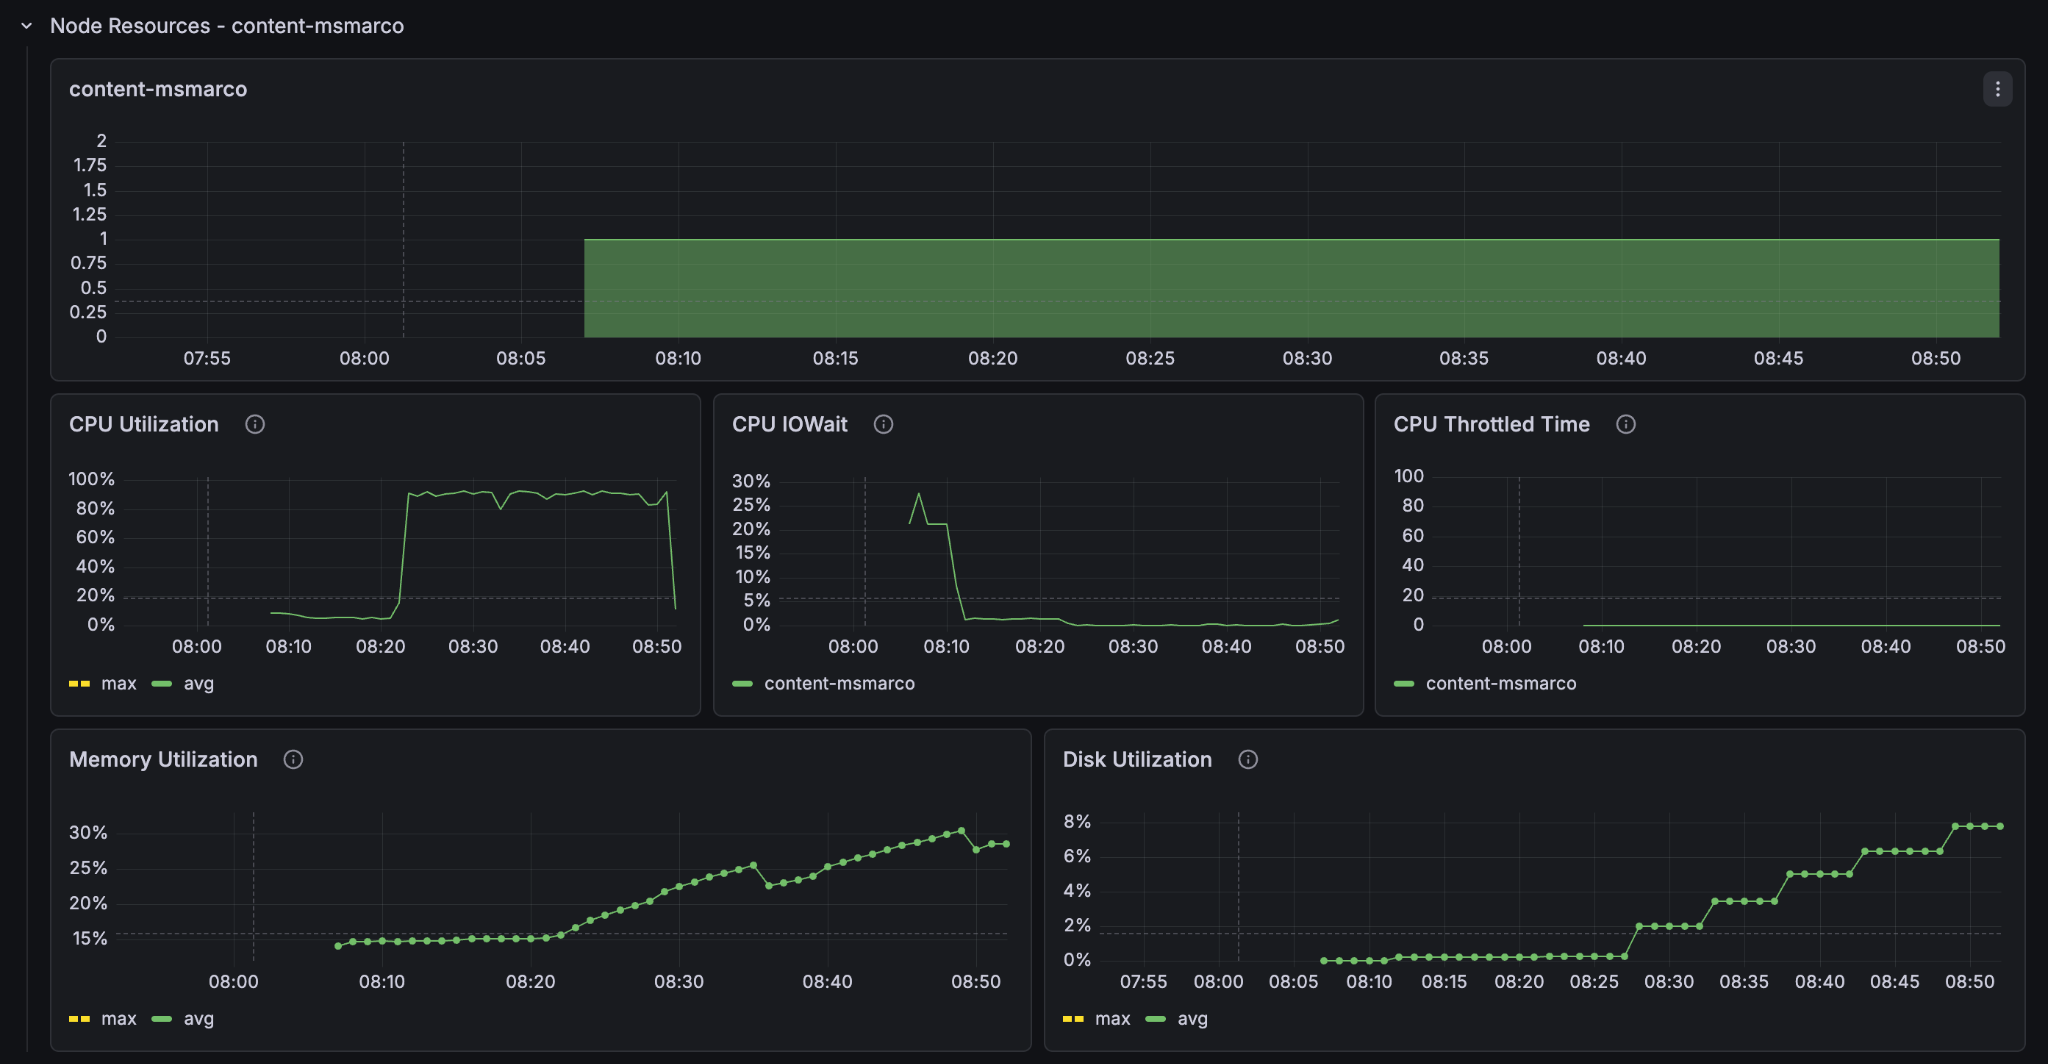
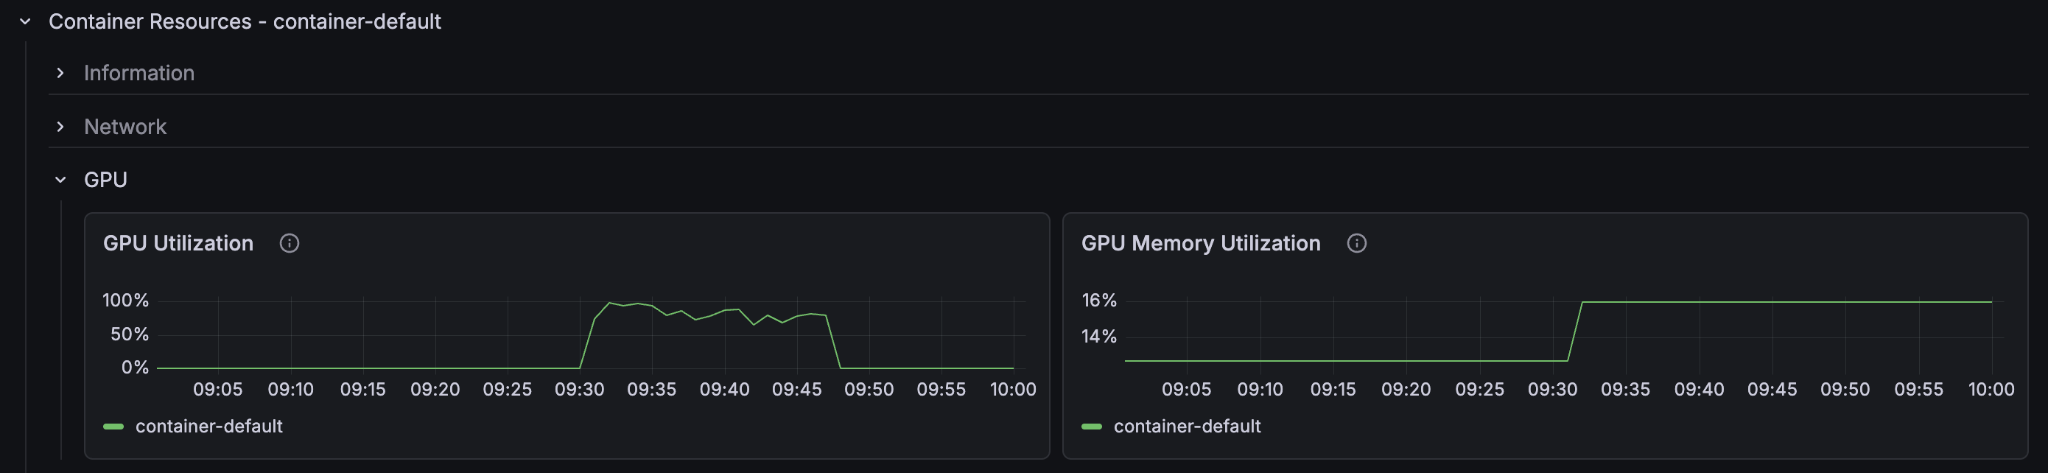
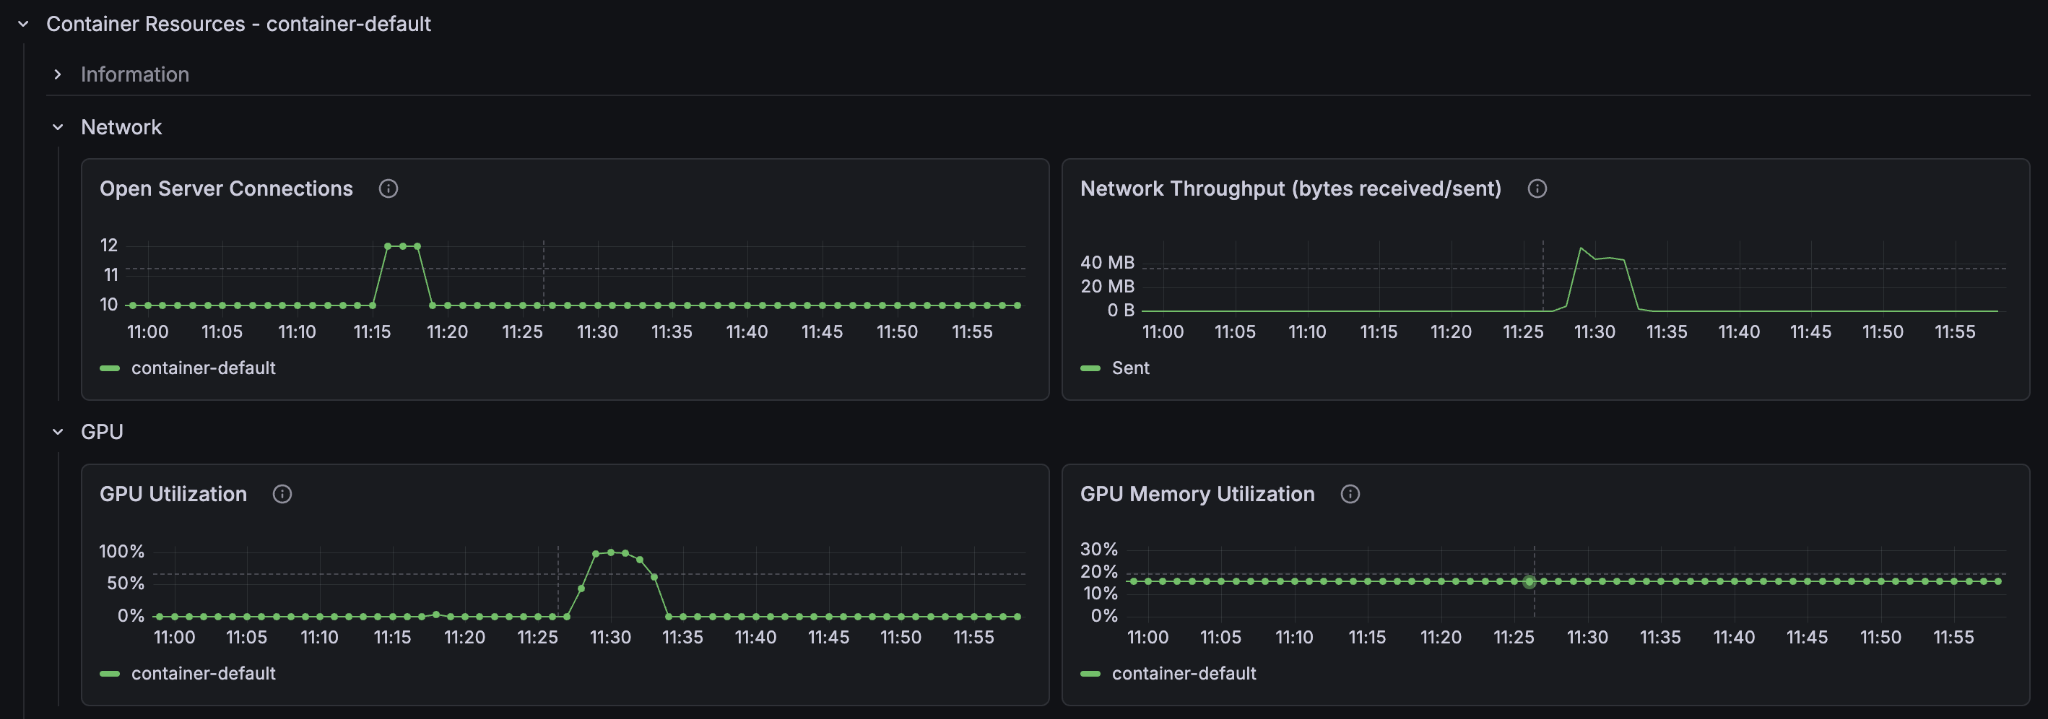
Look at the resources in the metrics and set it to show only the last 30 minutes so that we can see more clearly what went on. Notice the CPU-utilisation and the GPU-utilisation graphs. Notice that the GPU usage on the container node hit 100% and stayed there for the entire feeding process. The CPU usage on the container node peaked at 80% but leveled at around 60% and the content node’s CPU barely went over 50%.
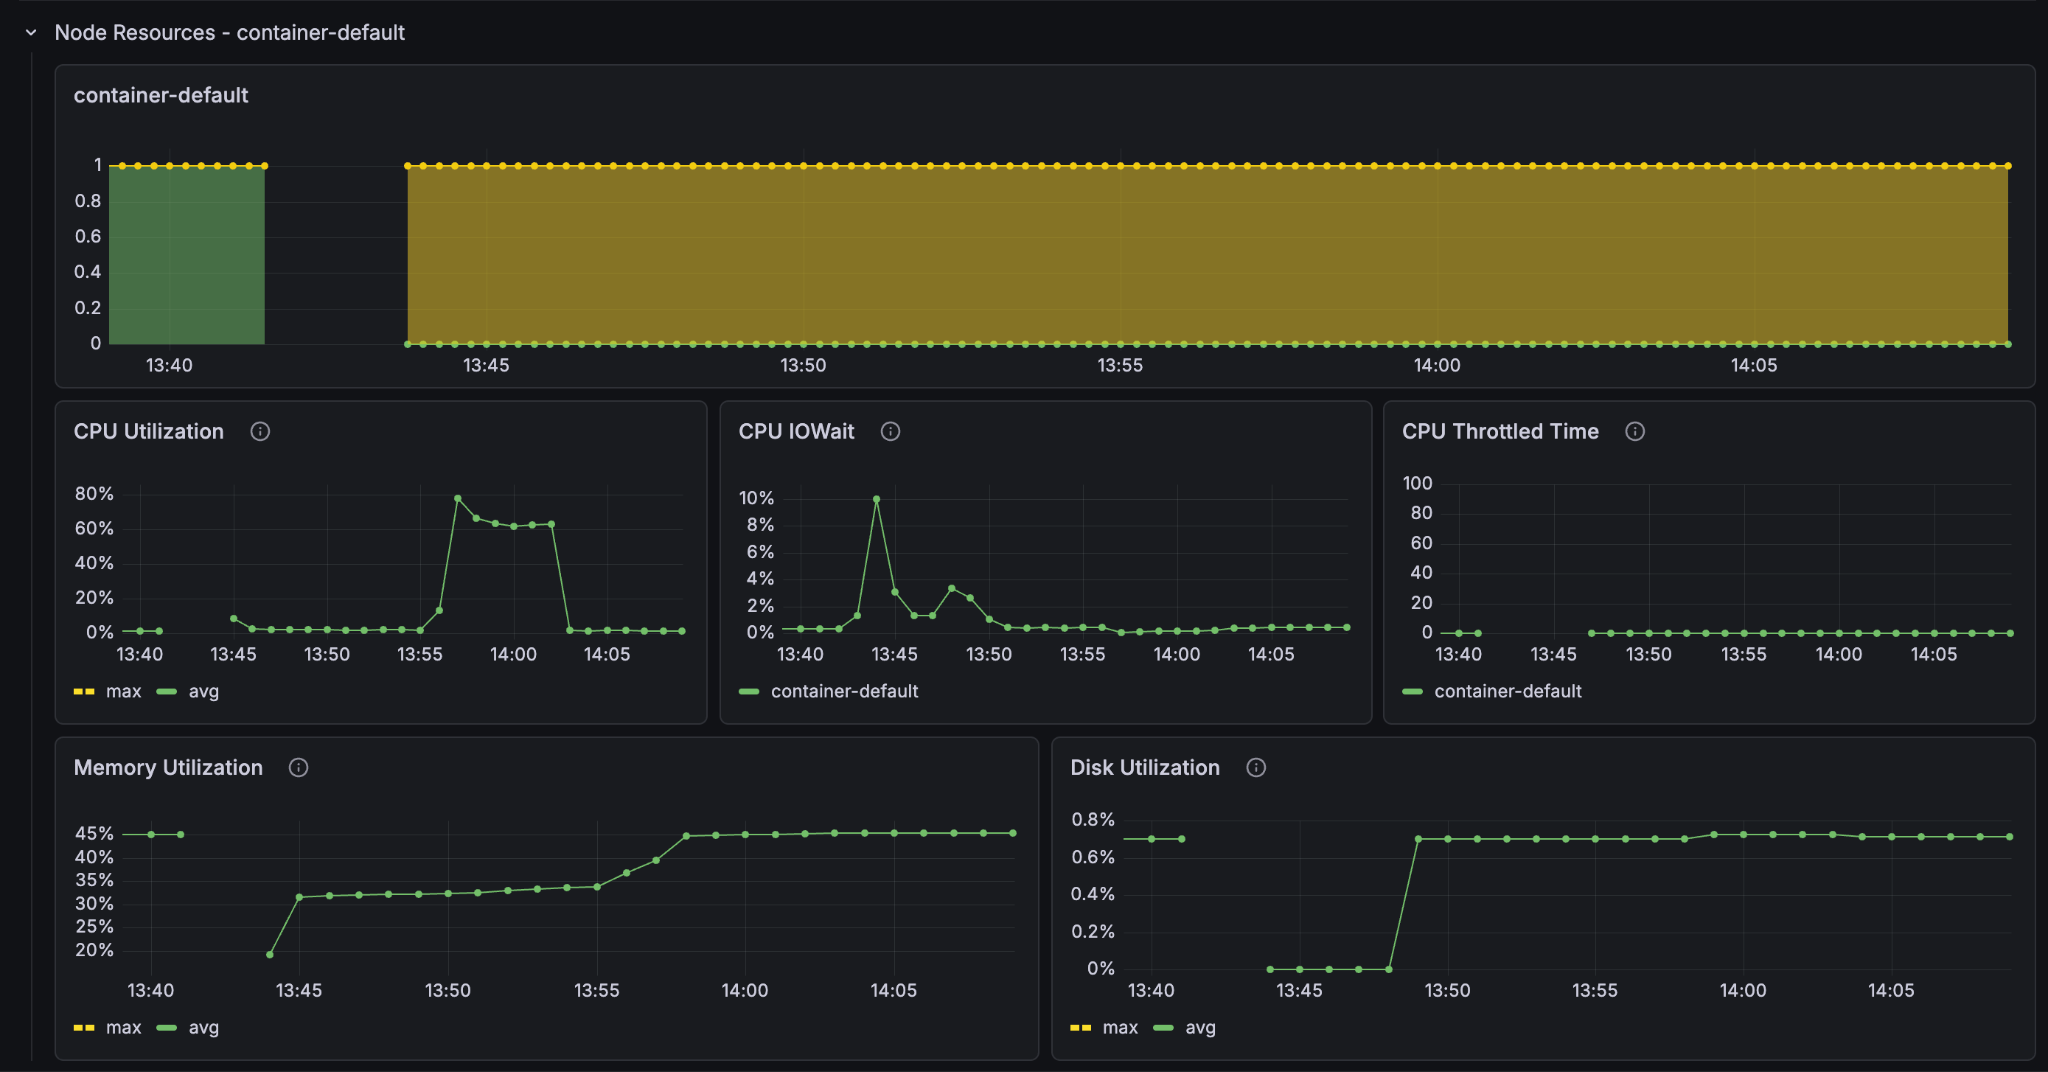
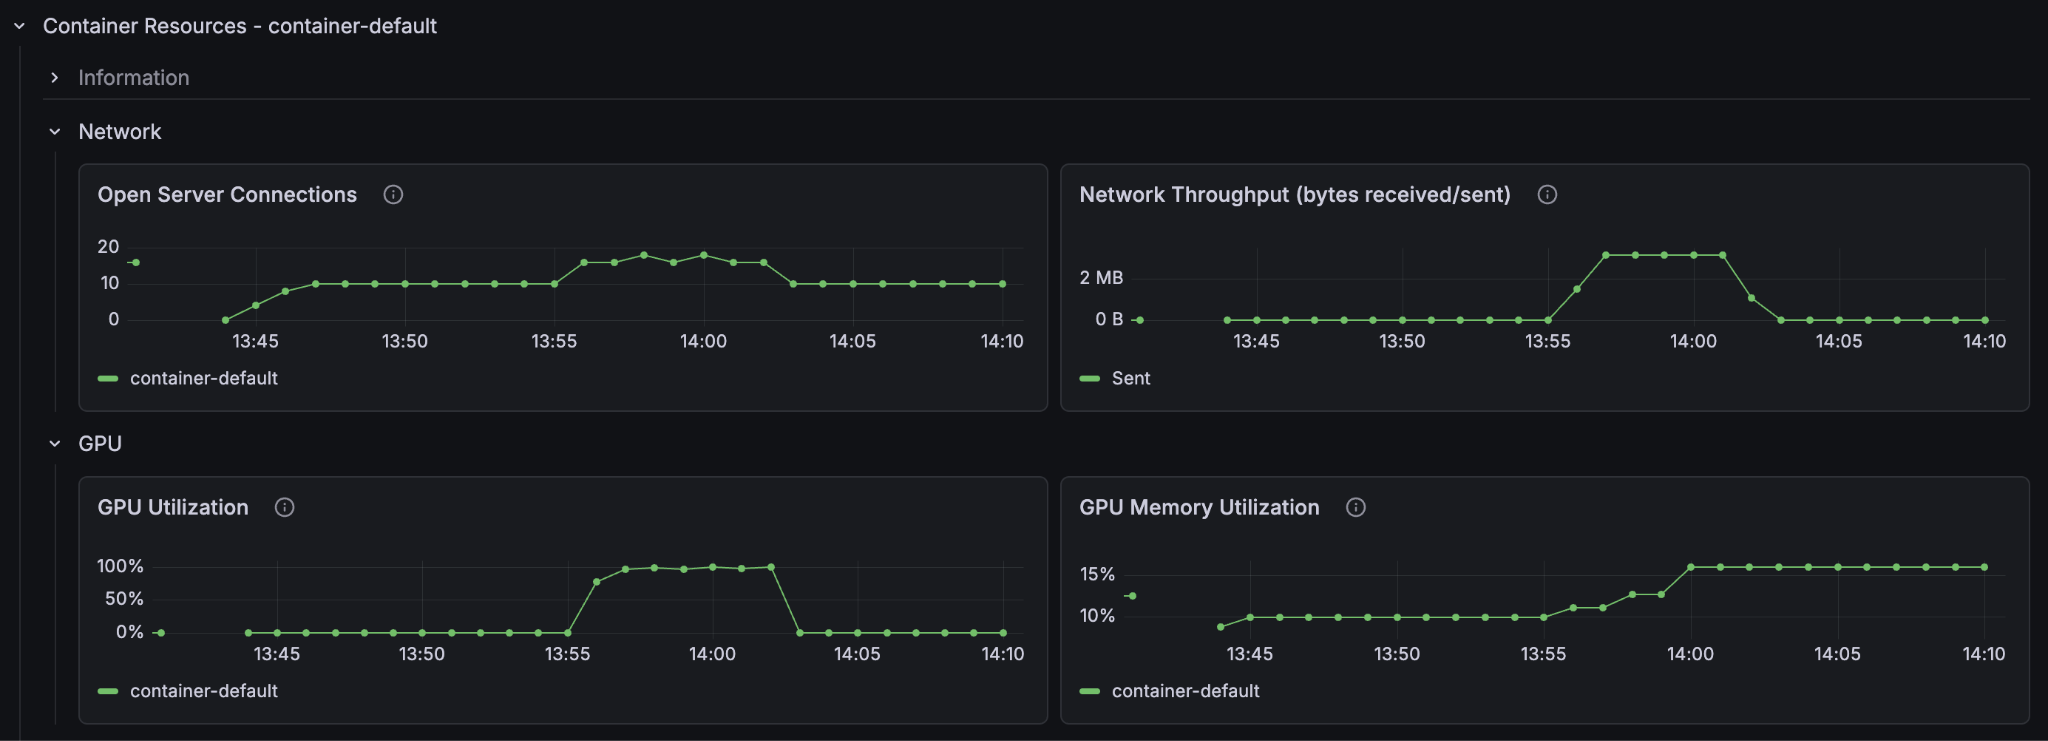
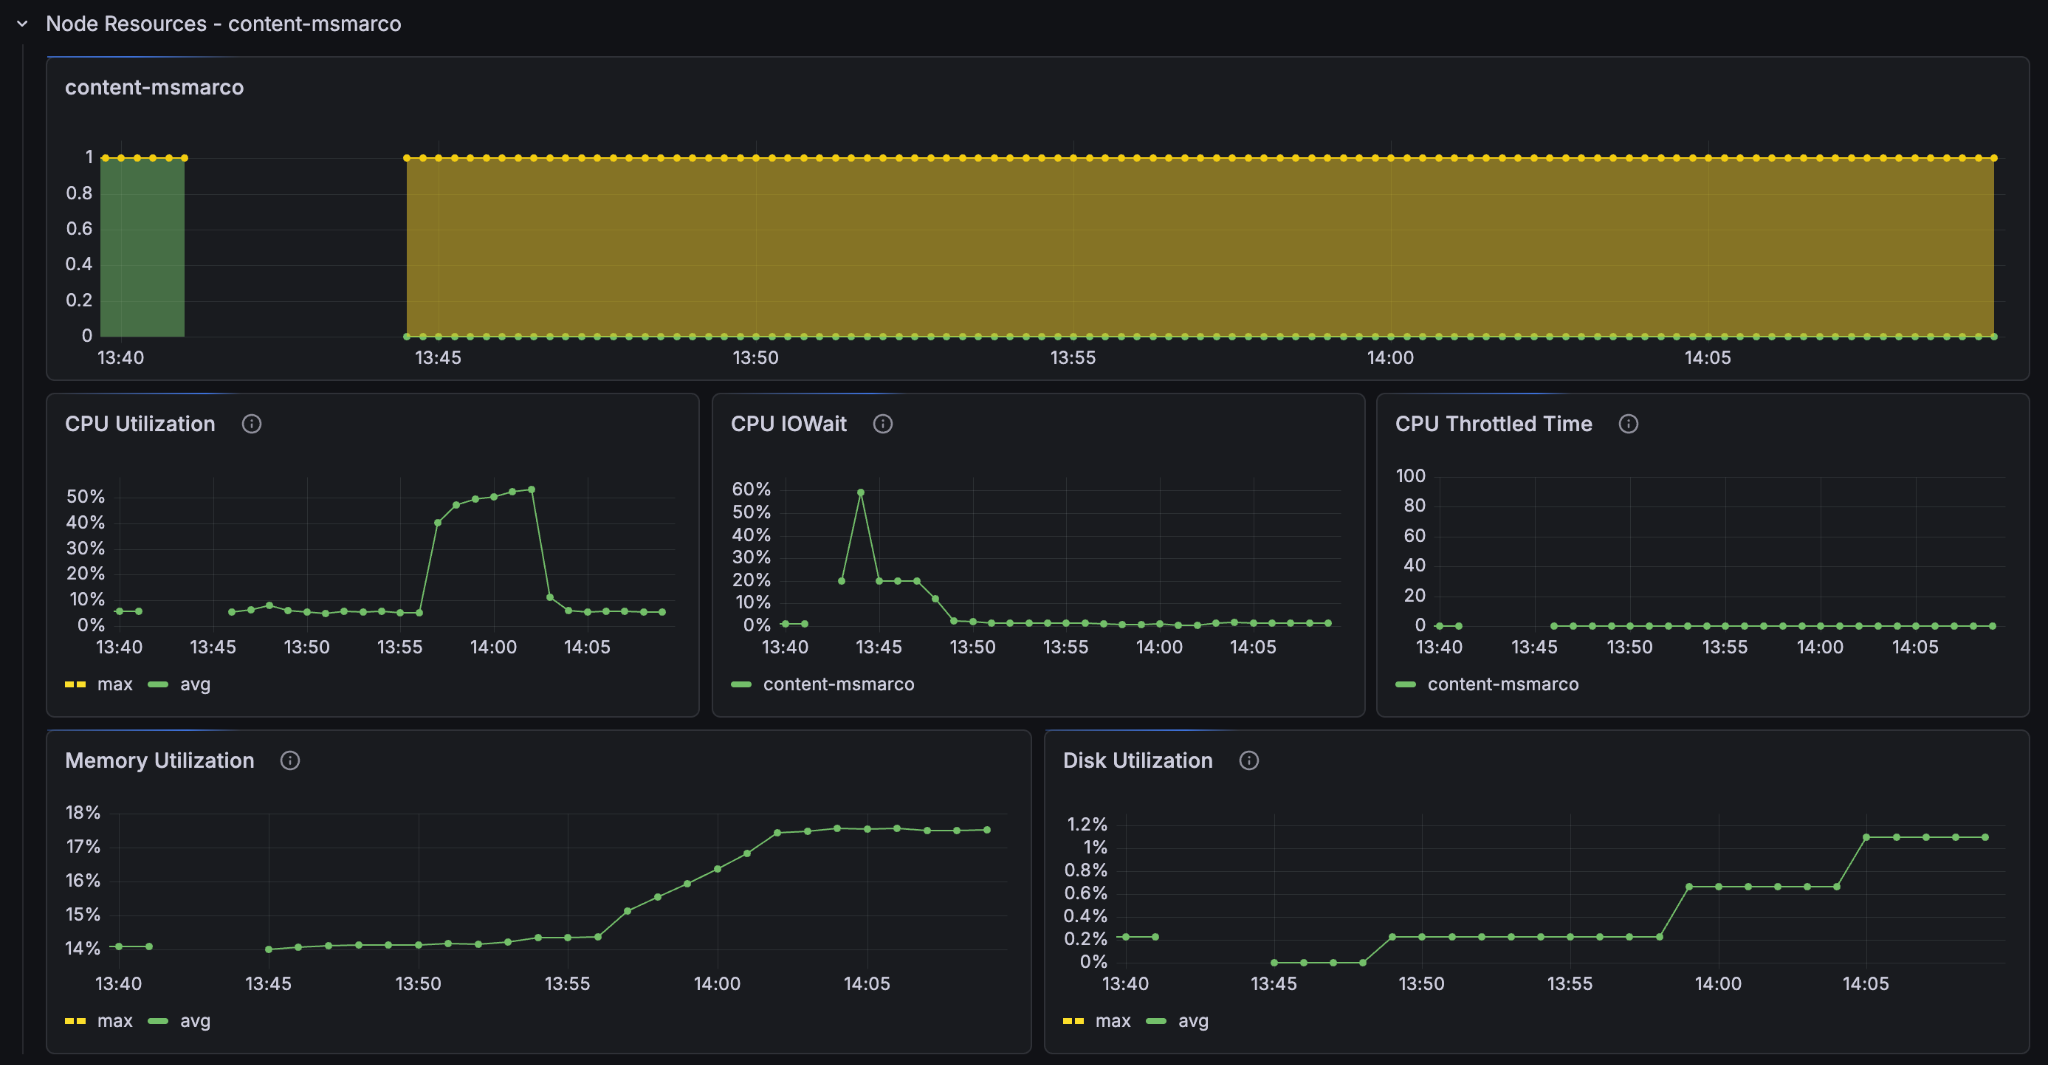
It is clear that on this Vespa Instance, the bottleneck for better feeding performance lies in the GPU processing. If we want to improve the feeding performance of the system, then we must increase the amount of GPUs in the container node.
Now that we know where the problem lies: Lets make it go faster! We’ll increase the amount of GPU nodes to 5 with the count="5" parameter in the container node in services.xml.
Container
<nodes deploy:environment="dev" count="5">
    <resources vcpu="4.0" memory="16Gb" architecture="x86_64" storage-type="local" disk="125Gb">
        <gpu count="1" memory="16.0Gb"/>
    </resources>
</nodes>
save the services.xml file and redeploy:
$ vespa deploy --wait 900
Now lets feed the larger dataset:
time vespa feed ext/corpus_transformed_500000.jsonl
Result
vespa feed ext/corpus_transformed_500000.jsonl 97.59s user 95.22s system 10% cpu 29:38.18 total (~8.8 hours for full dataset)
If we extrapolate the results we see we got around twice the speed of the single-container node instance. But why not 5 times the speed? Let’s look at the metrics.
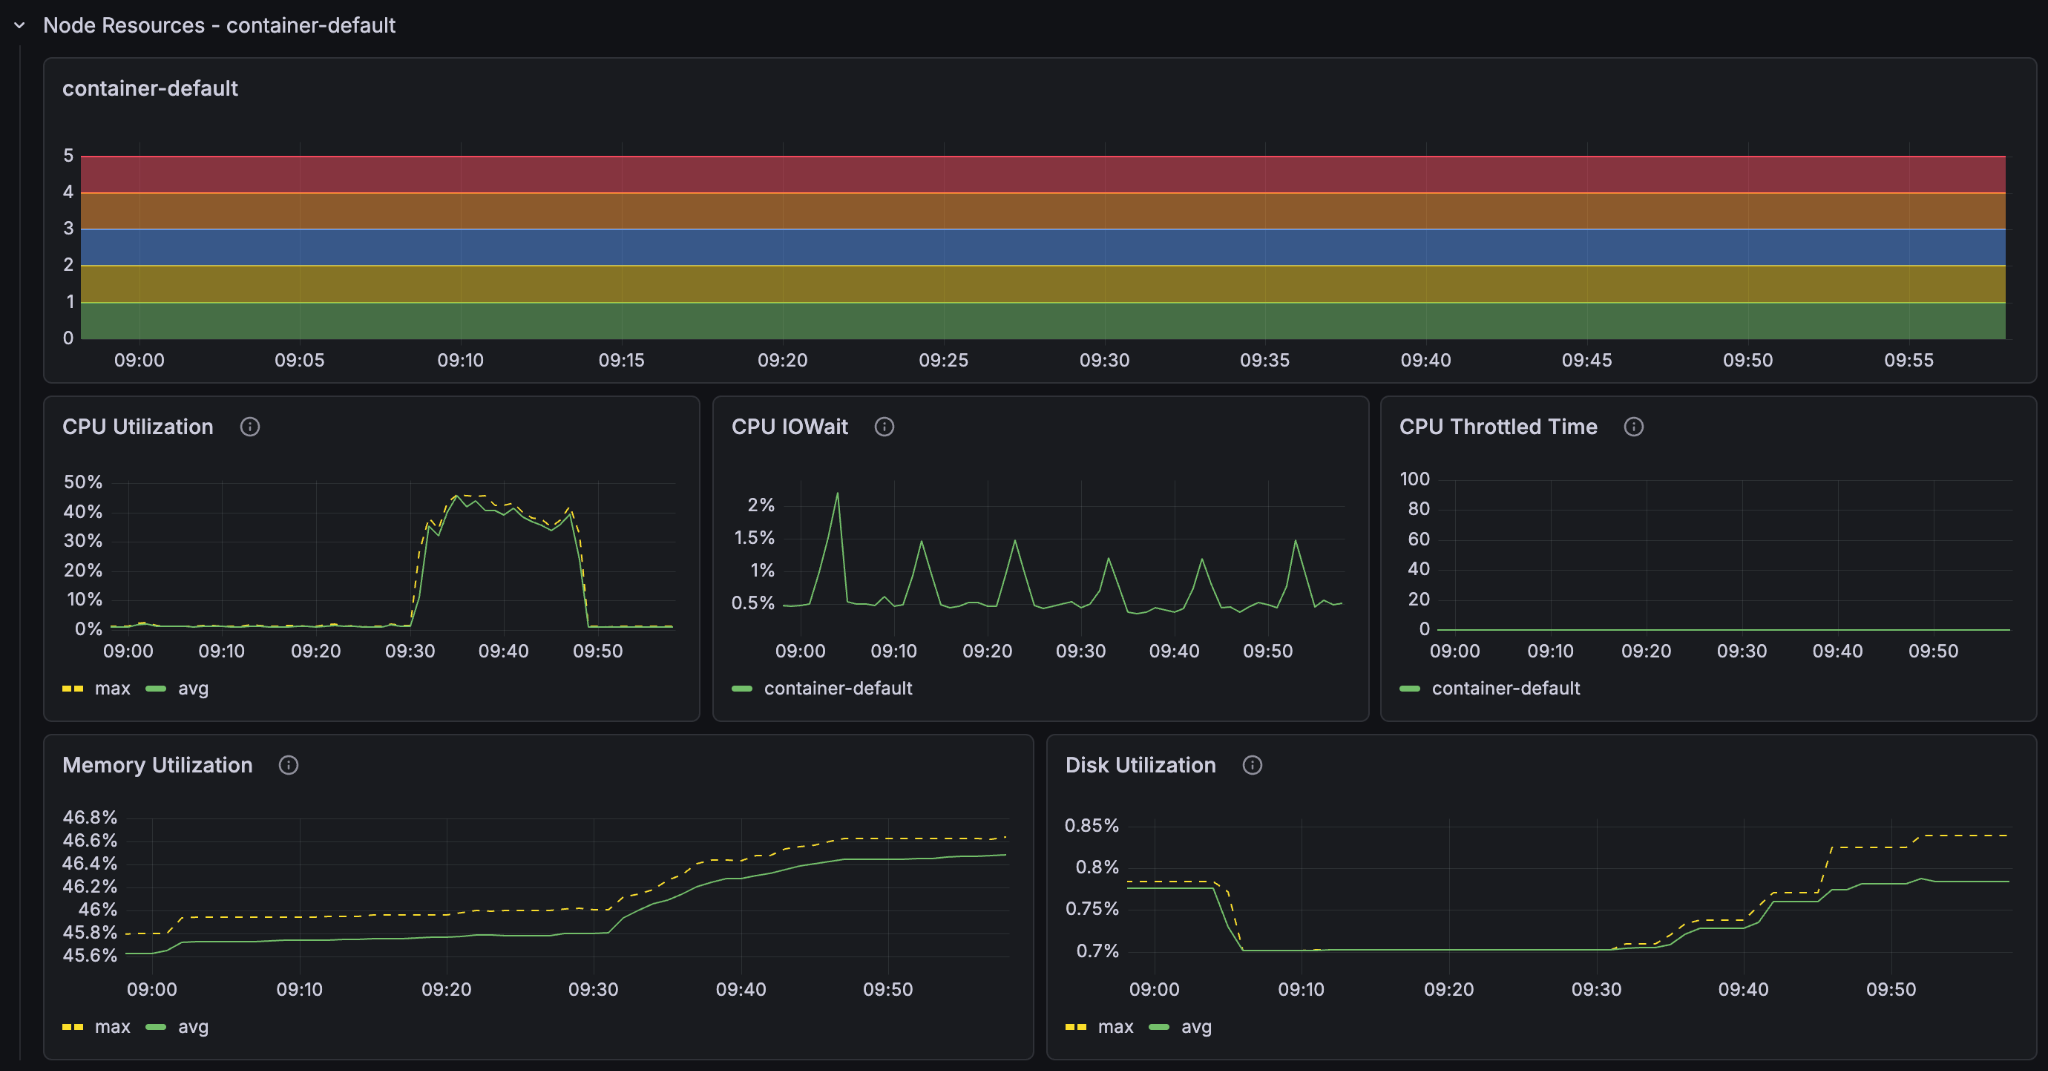
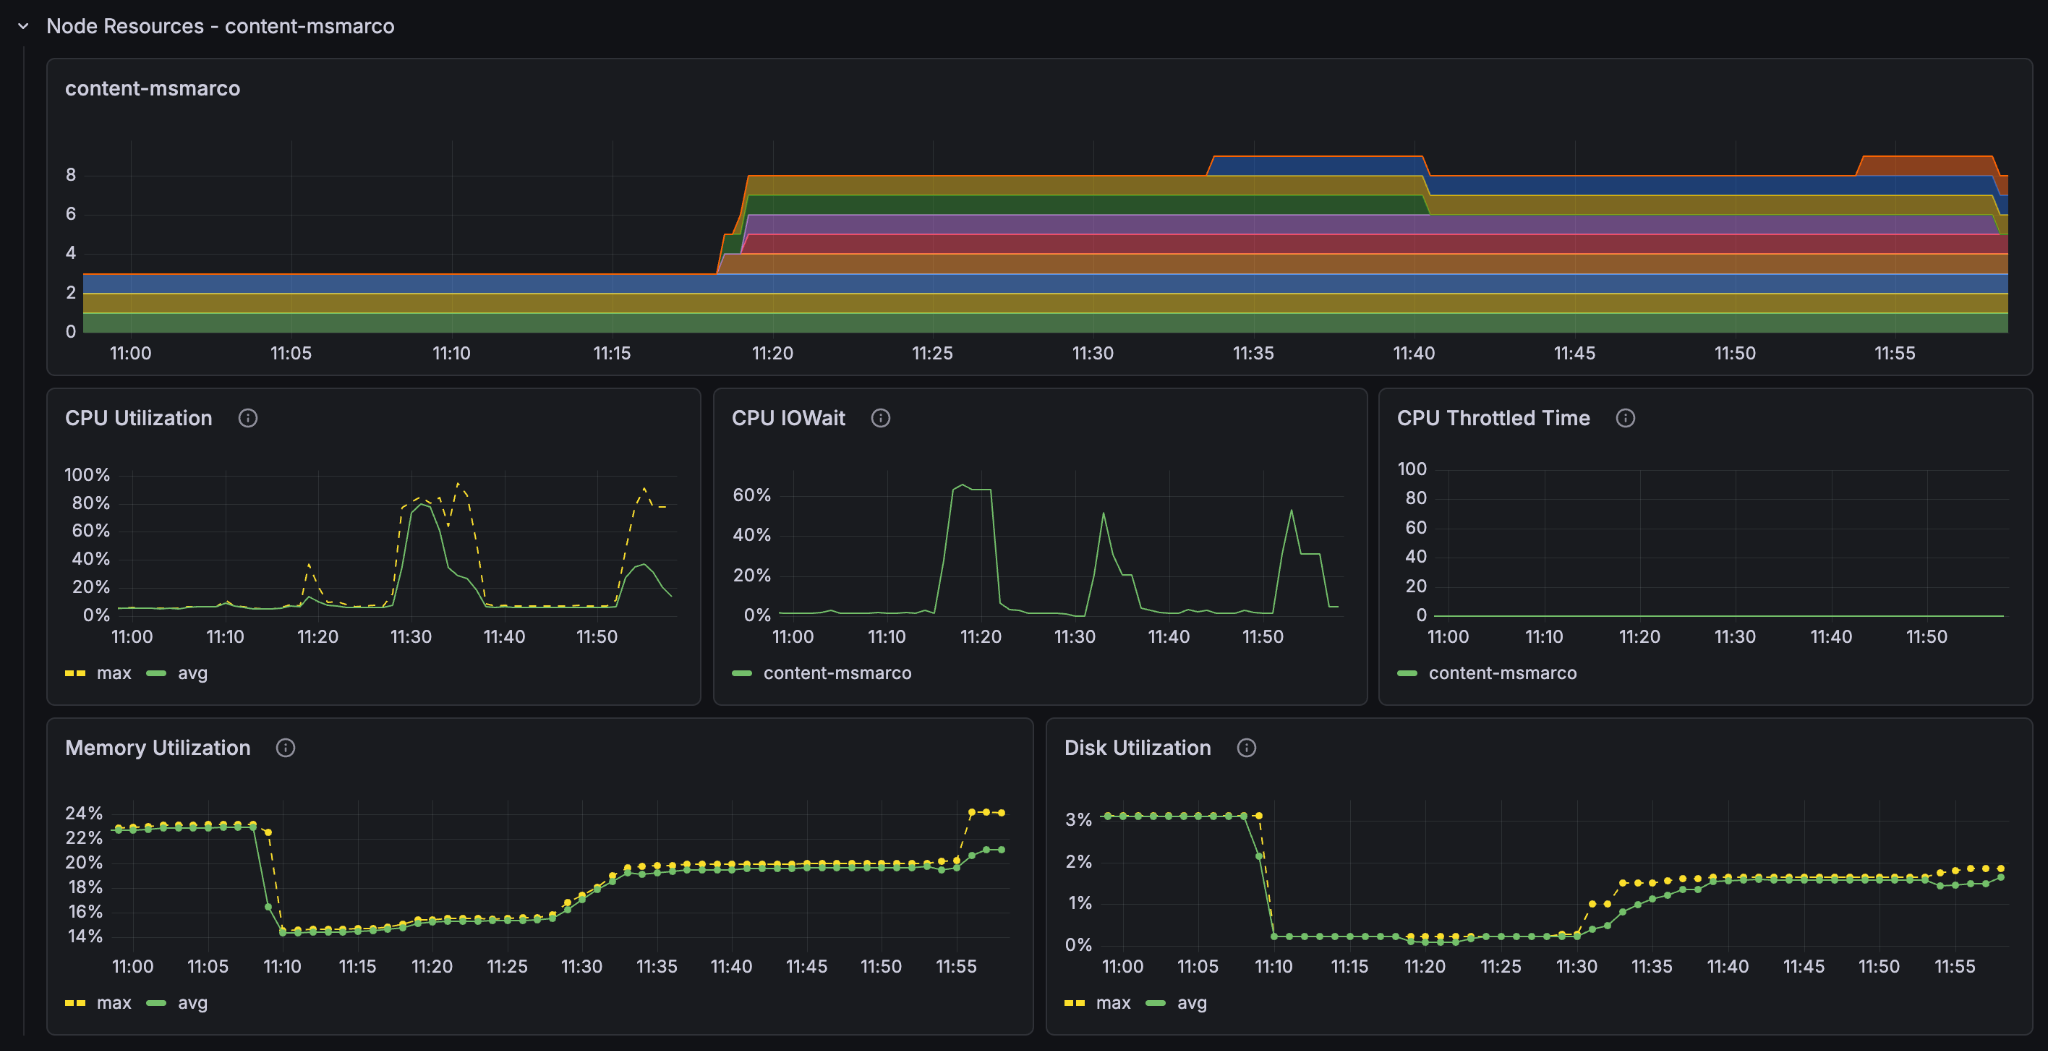
We see that the container GPU utilization now sits comfortably at around 50% and the container CPU at around 20-30%. But the content node CPU utilization sits near 100%. The 5 content nodes with GPUs saturate the single content node’s ability to take in data. We have found the new bottleneck of the system.
We’ll add some more content nodes:
Content
<nodes deploy:environment="dev" count="2">
    <resources vcpu="1.0" memory="8Gb" architecture="arm64" storage-type="local" disk="59Gb"/>
</nodes>
Delete the documents, redeploy, and refeed:
$ vespa deploy --wait 900
time vespa feed ext/corpus_transformed_500000.jsonl
Result
vespa feed ext/corpus_transformed_500000.jsonl 92.22s user 88.21s system 17% cpu 16:51.51 total (~5.0 hours for full dataset)
Adding the second content node almost doubles the performance again. Look at the metrics to see what is going on.
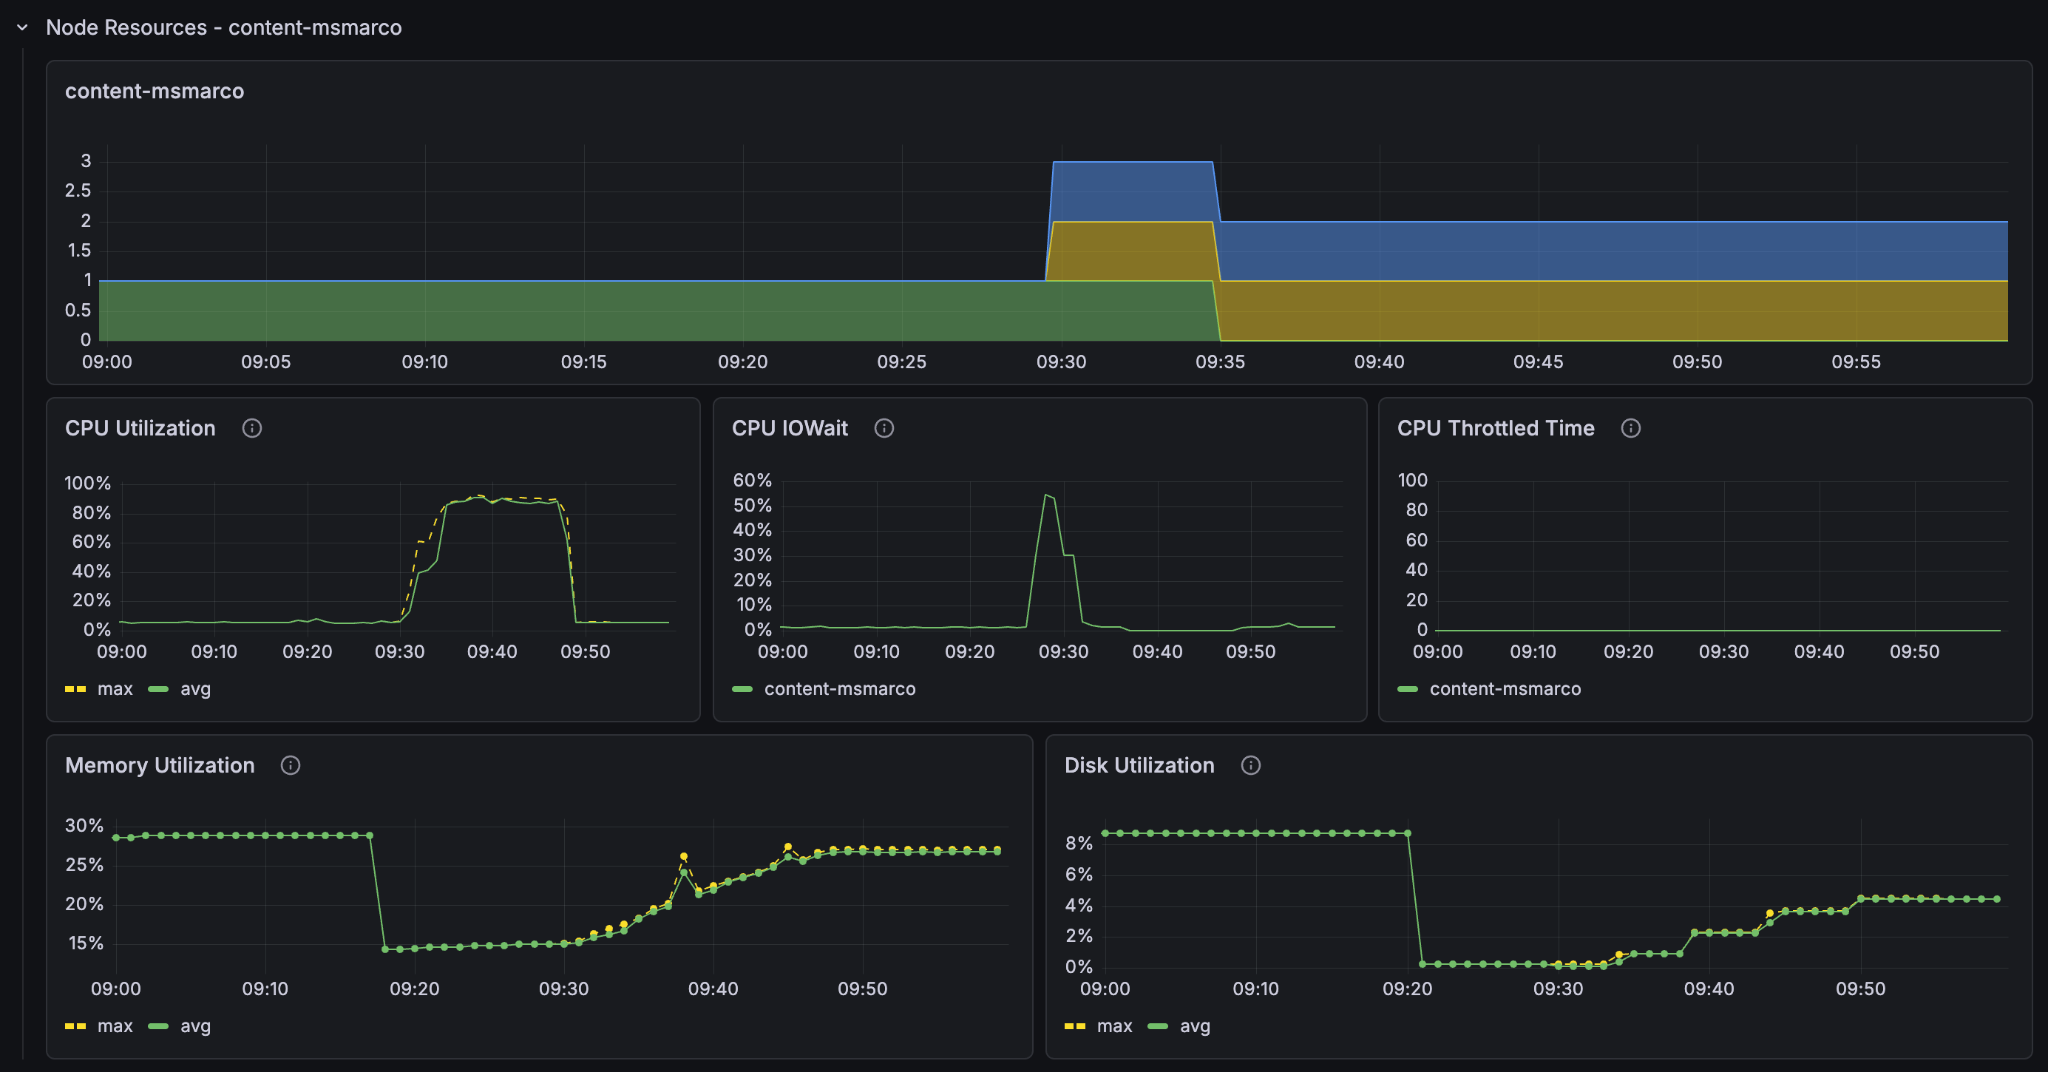
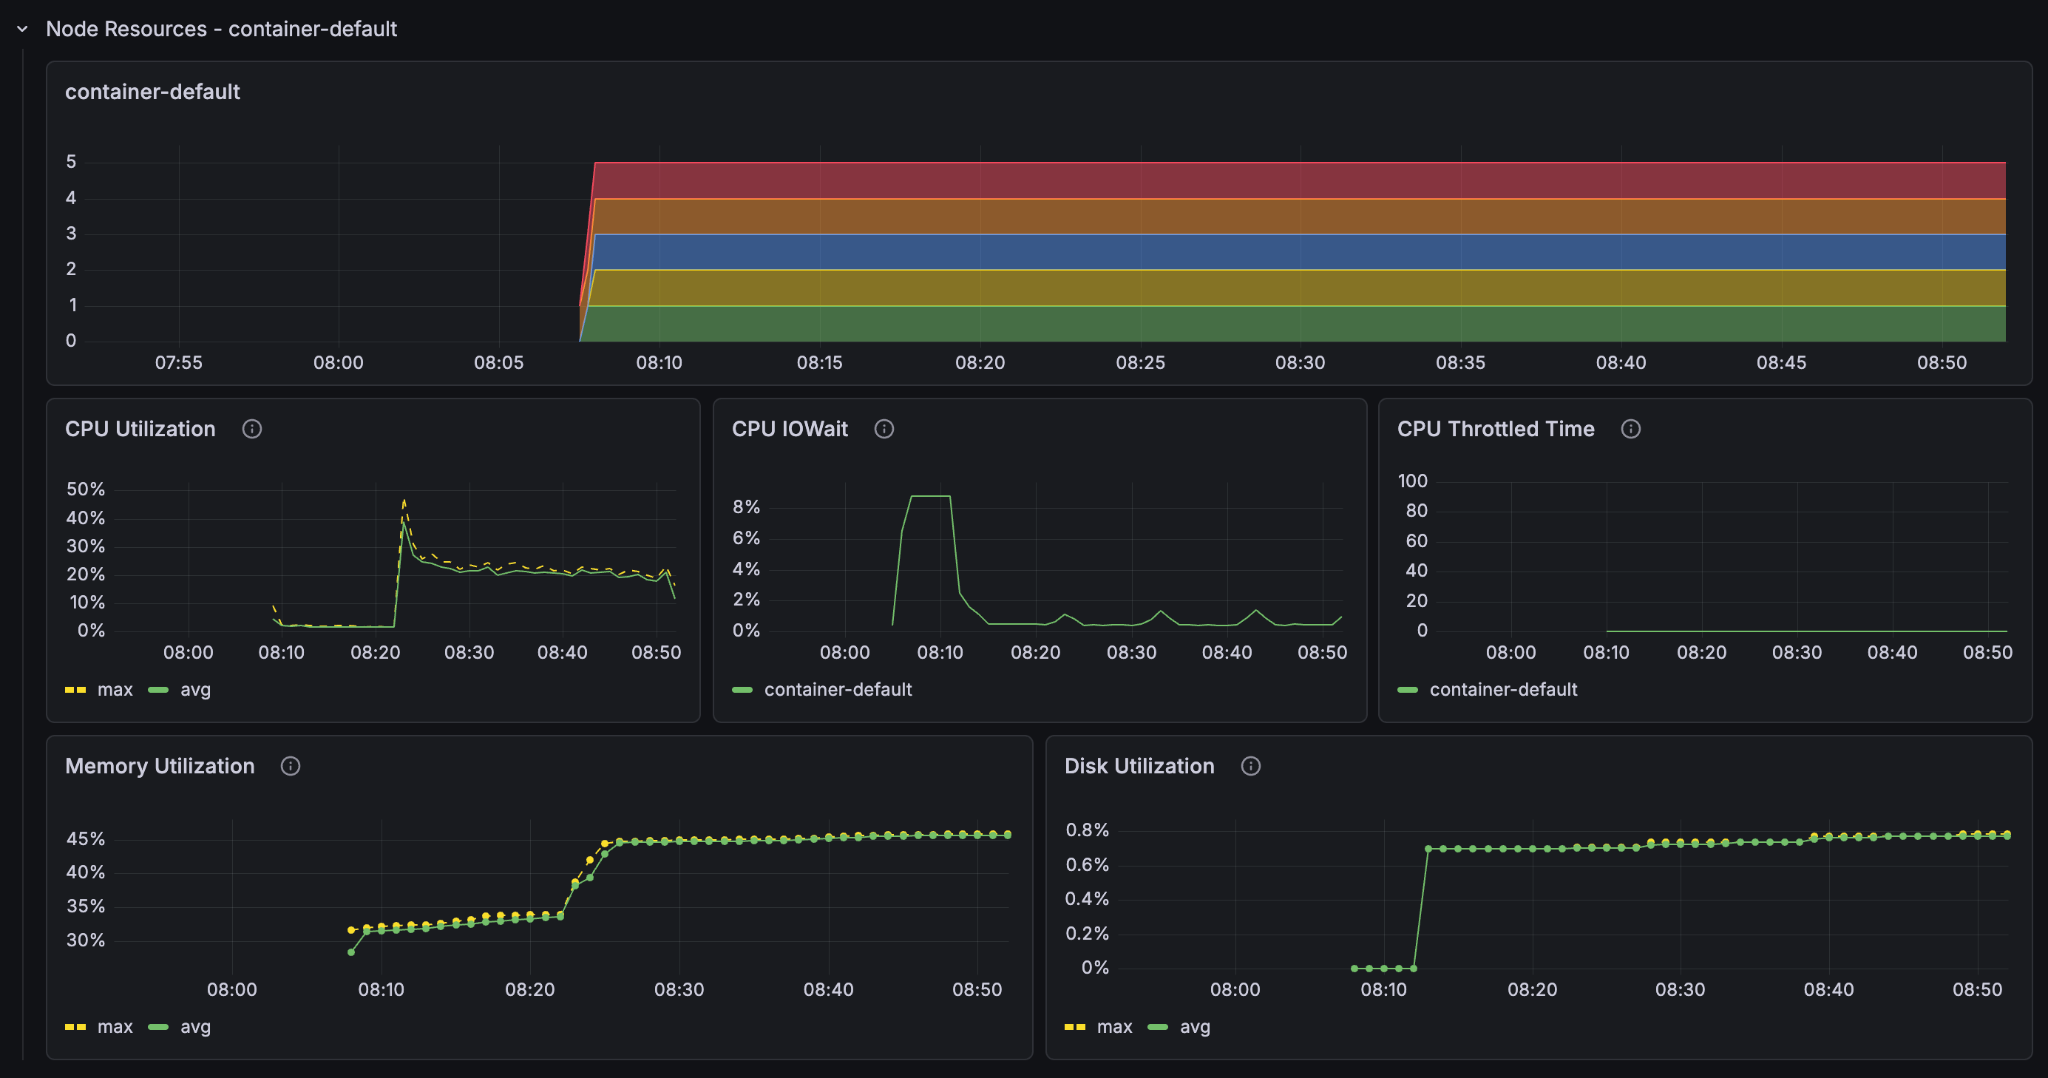
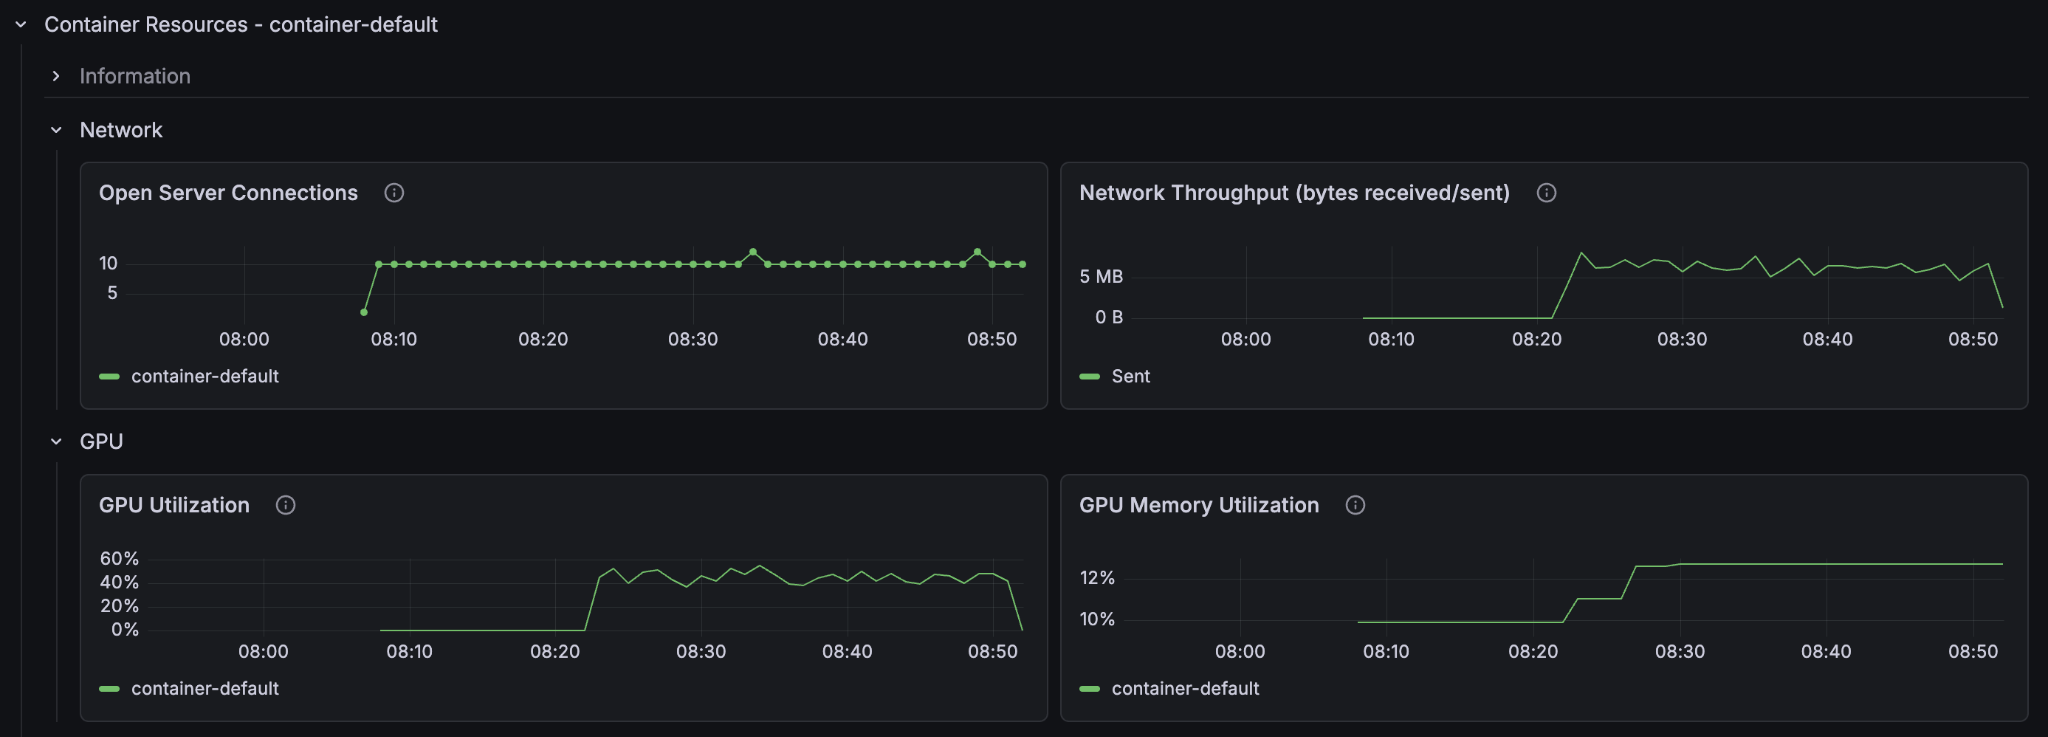
We see now that the container GPU (70-80%) and the content node CPU (80-90%) are both highly utilised, whilst the container node CPU is around 40%. Since we are already on the smallest instance type with a GPU we can’t scale down the cpu to match the others, so we have actually found a near optimal balance of container and content node resources for feeding this application.
Now that we have found a good balance, lets really scale up!
Feeding Fast: 20 GPUs
If we want serious feed throughput, we need serious hardware. Let’s scale the container and content nodes proportionately and jump to 20 GPU container nodes and 8 content nodes at the same time:
Container
<nodes deploy:environment="dev" count="20">
    <resources vcpu="4.0" memory="16Gb" architecture="x86_64" storage-type="local" disk="125Gb">
        <gpu count="1" memory="16.0Gb"/>
    </resources>
</nodes>
Content
<nodes deploy:environment="dev" count="8">
    <resources vcpu="1.0" memory="8Gb" architecture="arm64" storage-type="local" disk="59Gb"/>
</nodes>
NOTE: At this point you will most likely hit the quotaExceeded error when you try to deploy. Vespa Cloud tenants have a default quota that prevents you from accidentally spending a lot of money. If you want to go past it, reach out to Vespa support. With the limit raised, redeploy:
$ vespa deploy --wait 900
Delete any existing documents, wait for the count to hit zero, and feed the 500 000 line dataset again:
time vespa feed ext/corpus_transformed_500000.jsonl
Result
vespa feed ext/corpus_transformed_500000.jsonl 59.66s user 48.08s system 42% cpu 4:13.19 total (~1 hour 15 min for full dataset)
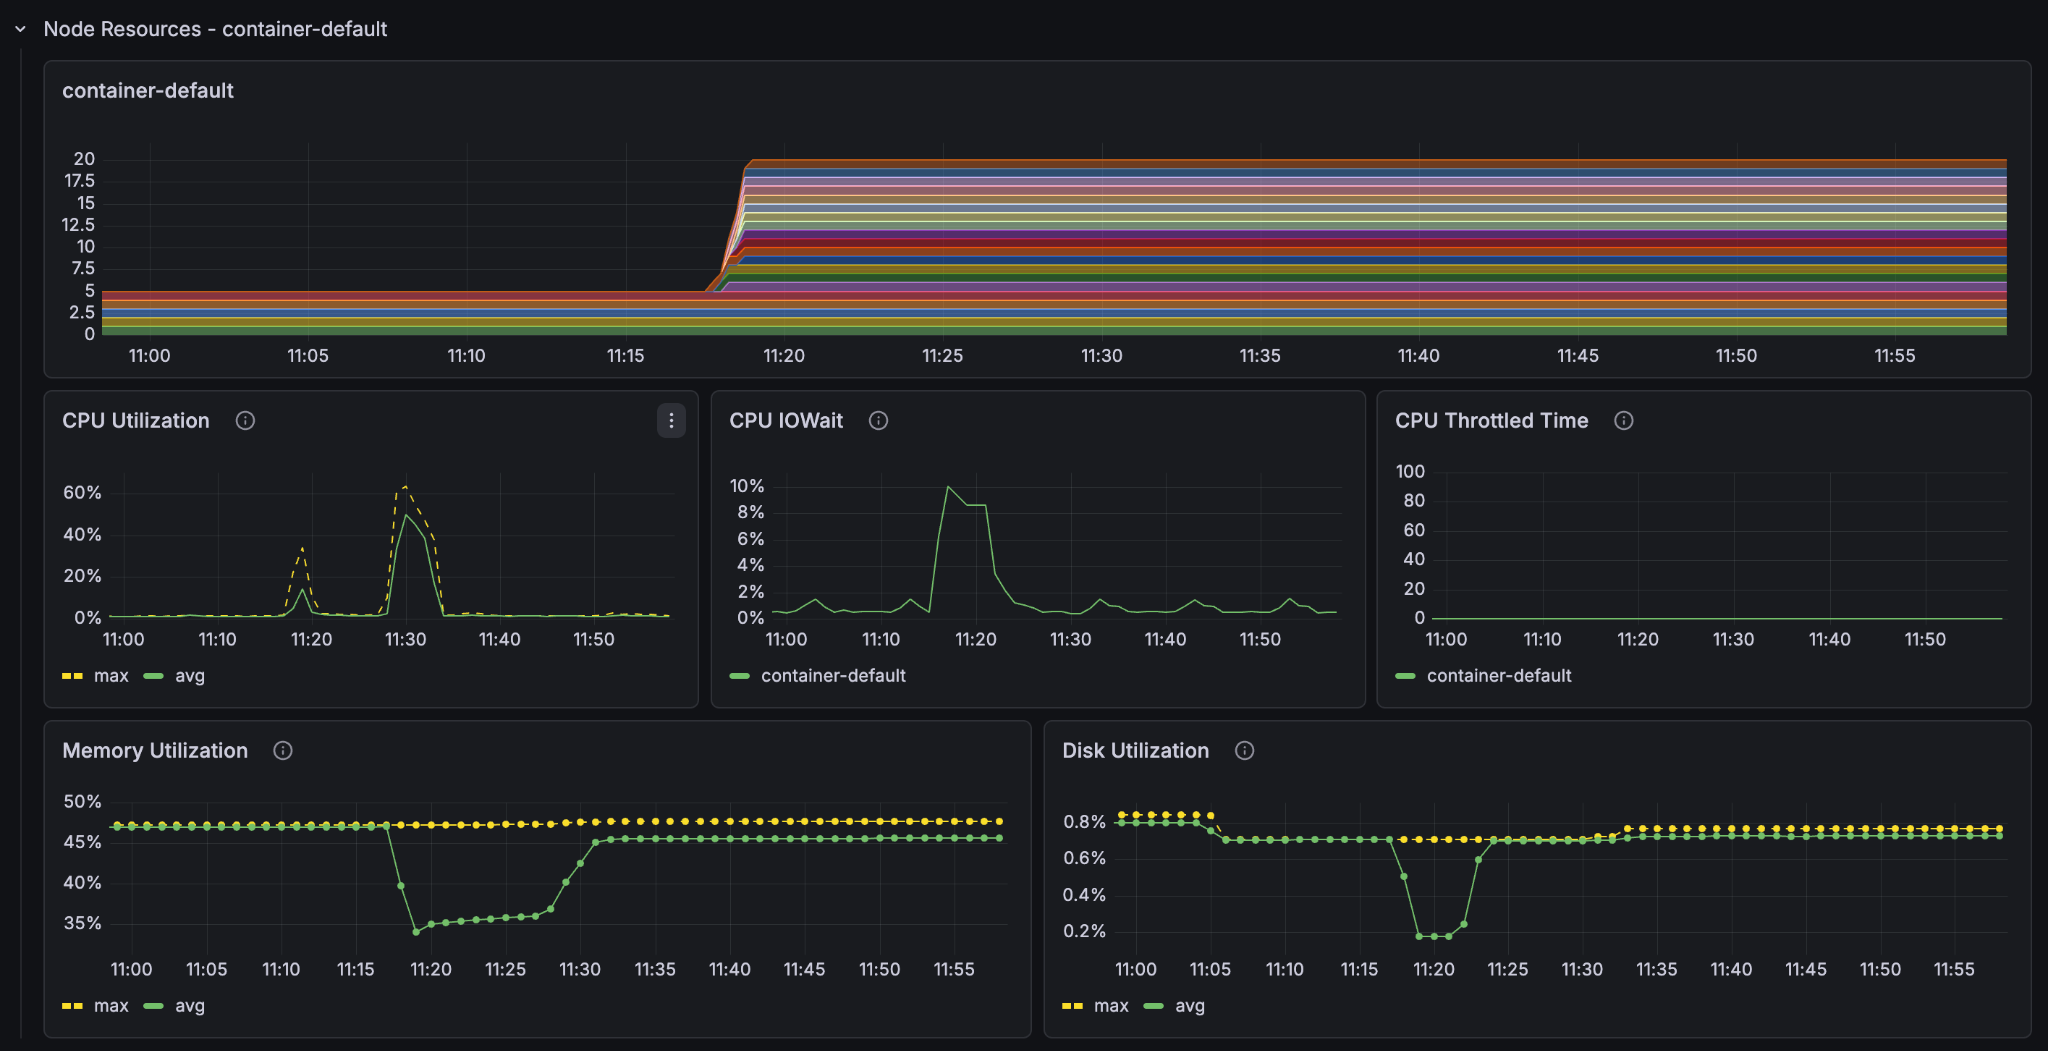
At an estimated 1 hour and 15 minutes for the full dataset we see that we got pretty much exactly 4x feeding speed with 4x the resources. We also see that the utilisation metrics are essentially the same as the last run (feeding at 11:30), just faster.
Feeding Furiously: 100 GPUs
Finally, because we can: 100 GPU container nodes and 40 content nodes, and this time we will feed the full 8.8 million passage dataset in one go.
Container
<nodes deploy:environment="dev" count="100">
    <resources vcpu="4.0" memory="16Gb" architecture="x86_64" storage-type="local" disk="125Gb">
        <gpu count="1" memory="16.0Gb"/>
    </resources>
</nodes>
Content
<nodes deploy:environment="dev" count="40">
    <resources vcpu="1.0" memory="8Gb" architecture="arm64" storage-type="local" disk="59Gb"/>
</nodes>
Delete the documents, Deploy, then feed the full dataset:
time vespa feed ext/corpus_transformed_full.jsonl
Result
vespa feed ext/corpus_transformed_full.jsonl 695.31s user 605.48s system 108% cpu 20:04.23 total
The Vespa instance managed to process more than 8.8 million passages, with embeddings and ColBERT vectors computed for every single one, in just over 20 minutes (over a fast internet connection).
The feed client also gives us a nice summary at the end:
{
  "feeder.operation.count": 8841823,
  "feeder.seconds": 1201.608,
  "feeder.ok.count": 8841823,
  "feeder.ok.rate": 7358.324,
  "feeder.error.count": 399,
  "http.request.count": 8844266,
  "http.response.latency.millis.avg": 167,
  "http.response.code.counts": {
    "200": 8841823,
    "429": 2044
  }
}
The feeding process had an average feed rate of around 7358 documents per second. Now that is fast and furious!
Conclusion
The best way to scale your Vespa instance is to use the metrics dashboards to see where the bottlenecks lie. There is no singular best instance of Vespa as the computational requirements are highly dependent on how you define your application. Feed the instance a sizable corpus to see how it performs under sustained load, and adjust its resources accordingly.