How Analytical workflows, SQL queries and reasoning loops become agentic systems
For years, dashboards have been the primary interface for interacting with data. They surface metrics, visualize trends, and enable decision-making through charts and filters. But they also require users to interpret results, formulate follow-up questions, and manually investigate underlying causes.
What if that investigative layer could be system-driven?
This is where orchestration becomes critical.
Agentic AI systems are often described in terms of tool calling or large language models. In practice, however, the defining shift is not the tools themselves — it is the addition of an orchestration layer that can coordinate those tools, decide what to do next, and iteratively refine a response.
Dashboards present data. Agents coordinate workflows over data.
And increasingly, the people closest to the data — the ones who already write the queries, define the metrics, and understand the domain — are the ones building that coordination layer. Not because the tooling requires deep AI expertise, but because the hard part was never the model. It was always knowing what questions to ask of the data and in what order.
Before we go further, here is the core argument in five points:
- Tool calling is access. Orchestration is control. An LLM that can invoke a function is not an agent. An LLM that decides which functions to invoke, in what sequence, and what to do with the results — that is an agent.
- The core architecture is a loop— Decide, Execute, Observe — that can be implemented in under 40 lines of Python and works with any chat-completion LLM.
- You don’t need new components. Most data teams already have SQL queries, pipelines, and precomputed ML outputs. Orchestration coordinates what you already have.
- Domain-specific tools outperform general-purpose plugins in constrained enterprise settings. Curated tools with clear contracts beat broad toolkits.
- In a prototype, multi-step investigations that took ~15 minutes of dashboard navigation completed in under 30 seconds** of conversational interaction.
Tool Calling vs Orchestration
Many modern systems support tool calling — the ability for an LLM to invoke a predefined function such as a SQL query or API endpoint. This is useful, but it is fundamentally single-step execution: select one function, run it, return the output. No iteration, no result evaluation, no adaptive follow-up.
Orchestration is different. It manages how tools are used across multiple steps. Where tool calling is a single reflex, orchestration is a reasoning loop — sometimes called ReAct (Reasoning and Acting) that formalized the pattern:
- Interpret the user’s goal
- Decide on the next action (tool + parameters)
- Execute the tool
- Observe the result
- Update context with the new evidence
- Repeat until the goal is satisfied — or a round limit is reached
This transforms execution from a static pipeline into a stateful decision process. The system is no longer answering a question in one step — it is constructing a workflow dynamically, where each step is informed by the results of the previous one.
In code, the essential loop is compact:
def run_agent(goal, tools, call_llm, execute_tool, max_rounds=6):
messages = [
{"role": "system", "content": build_prompt_from(tools)},
{"role": "user", "content": f"Goal: {goal}"},
]
for round in range(1, max_rounds + 1):
response = call_llm(messages) # DECIDE
parsed = extract_json(response)
if parsed.get("action") == "final_answer":
return parsed["answer"] # DONE
action = parsed["action"]
params = parsed.get("params", {})
result = execute_tool(action, params) # EXECUTE
messages.append({"role": "assistant", "content": response})
messages.append({"role": "user", # OBSERVE
"content": f"Result of {action}:\n{result}\n\n"
f"Continue reasoning or return final_answer."})
return synthesize_from_partial_results(messages)
This is model-agnostic. It works with OpenAI, Anthropic, Databricks Model Serving, or any LLM that supports chat completions. The intelligence is not in the loop structure — it is in what the LLM decides to do at each step, and in how the tools and their output are designed.
From Analytical Pipelines to Agentic Systems
The components used in agentic systems are not new. Most data teams already have:
- SQL queries against warehouse tables
- Data pipelines that transform and aggregate
- Precomputed ML outputs (predictions, scores, classifications)
- Analytical transformations and KPI logic
These are not prerequisites to acquire. They are assets that already exist in most analytical organizations. The teams that built these pipelines — who understand the joins, the edge cases, the business logic embedded in a WHERE clause — already have the hardest piece of the puzzle. What they have not had, until recently, is a coordination mechanism that lets those assets compose at runtime.
What changes is how these components are coordinated.
Without orchestration:
> User → Query → Result
With orchestration:
> User → Orchestration Layer → Tool₁ → Evaluate → Tool₂ → Evaluate → … → Synthesized Answer
This shift enables systems to combine multiple data sources in a single investigation, adapt query paths based on what intermediate results reveal, refine outputs iteratively rather than returning a single static result, and generate explanations that synthesize across multiple retrievals.
The investment is not in new infrastructure. It is in the coordination logic that ties existing infrastructure together. And the people who understand that infrastructure most deeply are the ones who will build the most effective agents over it.
An Architecture in Practice
In a prototype system built for enterprise compliance analytics, the orchestration layer sits between the user interface and existing analytical tools.
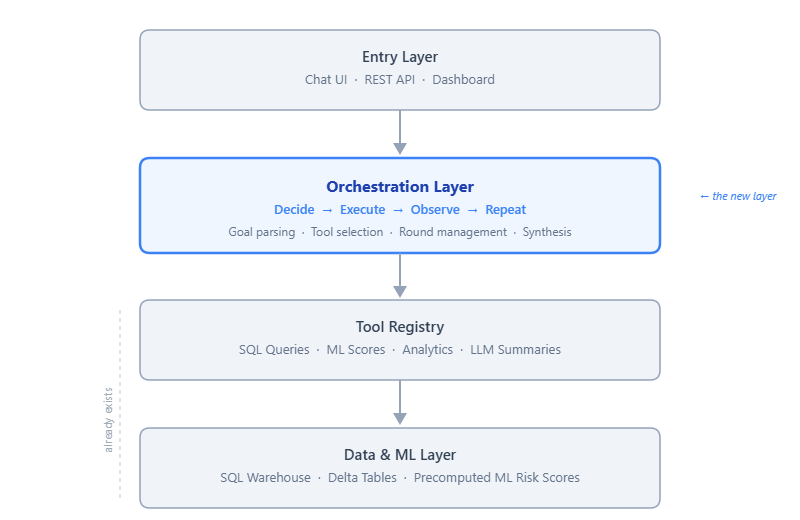
The system has four layers, each with a clear responsibility:
- Entry layer — User interaction through a chat UI, REST API, or dashboard.
- Orchestration layer — The multi-step reasoning loop: goal parsing, tool selection, round management, and result synthesis.
- Tool layer — ~20 domain-specific functions providing structured access to data and computation, including SQL-backed queries and LLM-assisted summaries.
- Data & ML layer— The persistence and inference substrate: SQL warehouse tables, precomputed ML risk scores, and Delta tables.
Tools as a single registry
A key architectural choice: all tools are defined in a **single registry** that drives both the LLM’s system prompt and the execution dispatcher.
TOOL_REGISTRY = [
{"name": "get_weekly_kpis",
"description": "Compliance KPIs for a specific week.",
"params": [{"name": "week_ending", "type": "date"}]},
{"name": "get_risk_scores",
"description": "ML-predicted risk levels for entities.",
"params": [{"name": "level", "type": "High | Medium | Low | All"}]},
{"name": "get_entity_history",
"description": "Recent activity history for a named entity.",
"params": [{"name": "name", "type": "string"}]},
{"name": "get_approval_flags",
"description": "Approvers with anomalous delay rates.",
"params": []},
# …
]
The system prompt is **generated** from this registry at startup. When the LLM reasons about which tool to call, it sees descriptions that match exactly what the dispatcher can execute. Add a tool in one place; the prompt and dispatch logic stay in sync. No drift between documentation and implementation.
ML as data, not endpoints
A second design choice is treating ML outputs as **data assets** rather than live inference endpoints. Risk scores are produced by a batch training job (in our case, a Random Forest over historical compliance patterns) and written to a table. The orchestration layer queries that table like any other data source.
This keeps agent latency low, separates the ML lifecycle from the agent lifecycle, and improves observability — you can query the same scores the agent used to verify its reasoning.
The Orchestration Loop in Practice
Abstract architecture is easy. Here is what the orchestration actually does when a manager asks:
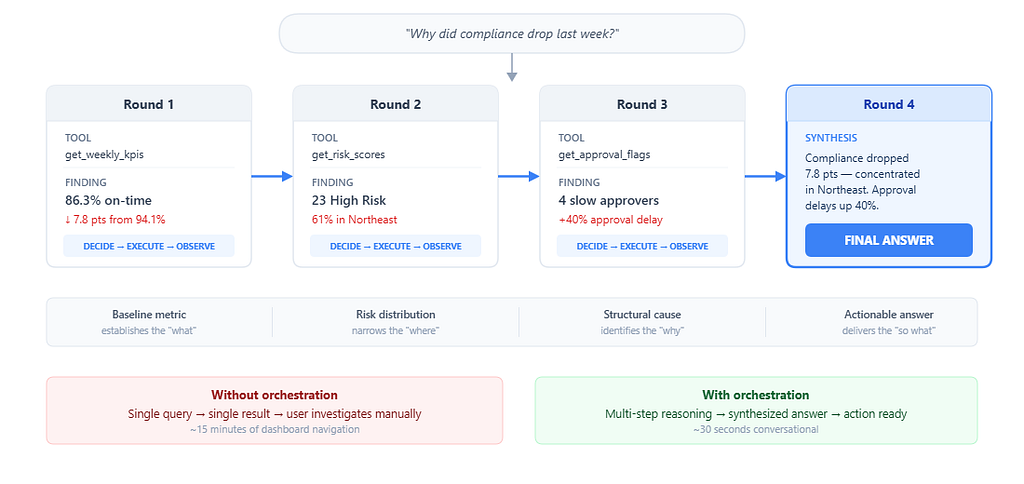
> *"Why did compliance drop last week?"*
**Round 1 - Establish the baseline.**
The LLM selects `get_weekly_kpis(week_ending="2026–03–07")`.
```
→ total_records: 847 | on_time: 731 (86.3%) | late: 93 | missing: 23
Previous week: 94.1% - a 7.8-point drop
```
The system now knows compliance dropped, but a number is not an explanation. It continues.
**Round 2 - Identify where the decline is concentrated.**
The LLM selects `get_risk_scores(level="High")`.
```
→ 23 entities flagged High risk
Region breakdown: Northeast accounts for 14 of 23 (61%)
Average consecutive late weeks: 3.2
```
The data reveals geographic concentration. The Northeast is disproportionately represented.
**Round 3 - Investigate structural causes.**
The LLM selects `get_approval_flags()` to check whether the issue is on the submission side, the approval side, or both.
```
→ 4 approvers with >50% late rate (last 4 weeks)
2 of 4 are in the Northeast region
Average approval delay increased ~40% week-over-week
```
Now the agent has a causal chain: approval delays in the Northeast are correlated with the compliance drop.
**Round 4 - Synthesize and answer.**
The LLM returns `final_answer`:

>*Compliance dropped from 94.1% to 86.3% last week (−7.8 points).
The decline is concentrated in the Northeast region, which accounts for 14 of 23 high-risk entities.
Two Northeast approvers had late-approval rates exceeding 50%, with average approval delays increasing roughly 40% over the prior week.
Recommendation: prioritize approval-process follow-up with Northeast managers this week.*
This answer required four operations, each building on the previous. No single tool call could produce it. The investigation path — baseline → risk distribution → approval analysis → synthesis — **emerged from the data**, not from a predefined workflow.
A human analyst performing the same investigation would open a dashboard, filter by week, scan the KPI tiles, switch to the risk view, filter by region, open the approver report, cross-reference the two views, and draft a summary. That is 15 minutes of manual navigation, minimum. The orchestrated agent completed it in under 30 seconds.
Where orchestration is less effective
Orchestration works best for investigative questions with **clear analytical paths** — questions that can be decomposed into data retrievals and comparisons. It becomes less effective when questions require subjective judgment or organizational politics the data cannot capture, real-time data the warehouse does not yet reflect, or causal reasoning beyond correlation.
Acknowledging these boundaries is important. Orchestration extends what analytical systems can do autonomously. It does not replace human judgment for ambiguous or high-stakes decisions.
Design Decisions That Shaped the System
- One tool per round. The model is instructed to call one tool per LLM response. This makes the loop predictable, debuggable, and easy to log. The cost is latency — a 4-tool investigation requires 4 LLM round trips. In practice, most queries resolve in 2–3 rounds, and our p95 response time stayed under 8 seconds.
- Bounded rounds. Unbounded loops are a reliability risk. If the LLM gets confused, a bounded loop (we use 6 rounds) ensures the system still returns something useful. When the cap is hit, the system synthesizes a summary from whatever was gathered rather than returning an error.
- Server-side date resolution. An early and persistent problem: the LLM hallucinated dates. “Last week” might produce a Friday two weeks in the past. We solved this by resolving all temporal references deterministically on the server. The LLM still chooses which tool to call and interprets the user’s intent — we only override the concrete dates. This hybrid pattern (LLM for reasoning, deterministic code for facts) proved essential.
- Formatted output over raw JSON. Early tool implementations returned raw JSON. We switched to formatted text tables with context annotations (e.g., “per server calendar,” “(14 of 23)”), and the quality of the LLM’s synthesis improved meaningfully. The LLM reasons better when tool output resembles what a human analyst would write in working notes, not what an API would return.
Observed Results
Iterated over the orchestration design, tool library, and frontend across several weeks. Observations from the prototype:
Multi-step investigation time dropped from ~15 minutes to ~30 seconds.** Queries that required navigating dashboards, filtering views, and cross-referencing reports became single conversational interactions.
8 of 10 standard compliance questions were answered without human intervention.** KPI summaries, risk identification, approver analysis, and manager briefs resolved autonomously. The two failures involved ambiguous time references — later addressed by server-side date resolution.
Average rounds per query: 2.1. Maximum for standard queries: 4.** Simple questions (KPI lookup) resolved in 1–2 rounds. Investigative questions (“why did X drop?”) took 3–4.
20 domain tools covered the full analytical surface.** We started with 8 and grew to 20. The final additions were refinements (splitting weekly vs. range variants of the same metric), not new capabilities. Tool count was not the bottleneck — tool *design* was. The quality of each tool depended far more on understanding the data and the business context than on any LLM-specific knowledge.
Getting Started
If you want to experiment with orchestration over your own analytical data, here is a practical starting path.
- Identify 3–5 high-frequency queries. Start with the questions your team already answers — the ones analysts run every Monday, the dashboards that get refreshed every sprint. Each becomes a tool: a named function with a clear description, typed parameters, and a SQL-backed implementation.
- Implement the loop. Use the Decide–Execute–Observe pattern from this article. It works with any chat-completion LLM. The loop is model-agnostic; the intelligence comes from the tools and the LLM’s reasoning over them.
- Add guardrails early. Three guardrails that will save you debugging time: deterministic date resolution server-side, a round cap (6 is a good default) with partial synthesis when hit, and a tool allowlist so only registered tools can execute.
- Iterate on tool output format. The text your tools return to the LLM matters more than you expect. Clean tables with row counts, date ranges, and brief annotations produce better synthesis than raw JSON.
Frameworks and tools worth considering:
- LLM— OpenAI, Anthropic, Databricks Model Serving, or a local model. Any chat-completion API works.
- Data— Databricks SQL, SQLAlchemy, or direct REST APIs against your warehouse.
- Orchestration — The ReAct loop is ~40 lines. LangChain and LlamaIndex offer agent abstractions, but for domain-specific tools a custom loop gives more control and fewer layers to debug.
- Frontend — Flask or Streamlit for prototyping; React for production.
- MCP (Model Context Protocol)— Wrapping tools as an MCP server makes them accessible to multiple AI clients (Cursor, Claude Desktop, etc.) without coupling to a single provider.
Conclusion
Agentic AI systems are often associated with advanced models or new frameworks. In practice, the core architectural shift is simpler and more fundamental.
Orchestration introduces a control layer that determines which tools to use, in what sequence, and based on which intermediate results. It transforms analytical systems from static pipelines into dynamic, goal-driven workflows.
The transition from dashboards to agents is not about replacing existing components. It is about introducing a layer that can coordinate them — a loop that reasons over data the way an analyst would, but faster, and without requiring the user to know where to look.
The components are familiar. The architecture is a loop. The work that matters is in the tool design, the guardrails, and the discipline of keeping the system grounded in the data it can actually reach.
As agentic systems mature, the competitive advantage will not belong to whoever has the most powerful model. It will belong to whoever has the deepest understanding of their data, their domain, and the analytical workflows that already encode years of institutional knowledge. The orchestration layer simply makes that understanding composable.
Start with the loop. The rest follows.
Orchestration: The Layer That Transforms Dashboards into Agents was originally published in Towards AI on Medium, where people are continuing the conversation by highlighting and responding to this story.