More than a trillion dollars are lost every year due to system failures. To resolve them, engineers must troubleshoot outages quickly.
An important task in incident response involves analyzing observability metrics, or time series data that snapshot the health of software systems. For example, an engineer for a service may use Datadog to answer questions like “When did latency start increasing?” and “What metrics outside of latency are also behaving abnormally?” to localize the root cause of the anomalous behavior. These time series question-answering (TSQA) tasks are essential for engineers, and present challenging and necessary tasks for SRE models and agents to perform. In this work, we explore the degree to which AI models can perform TSQA tasks.
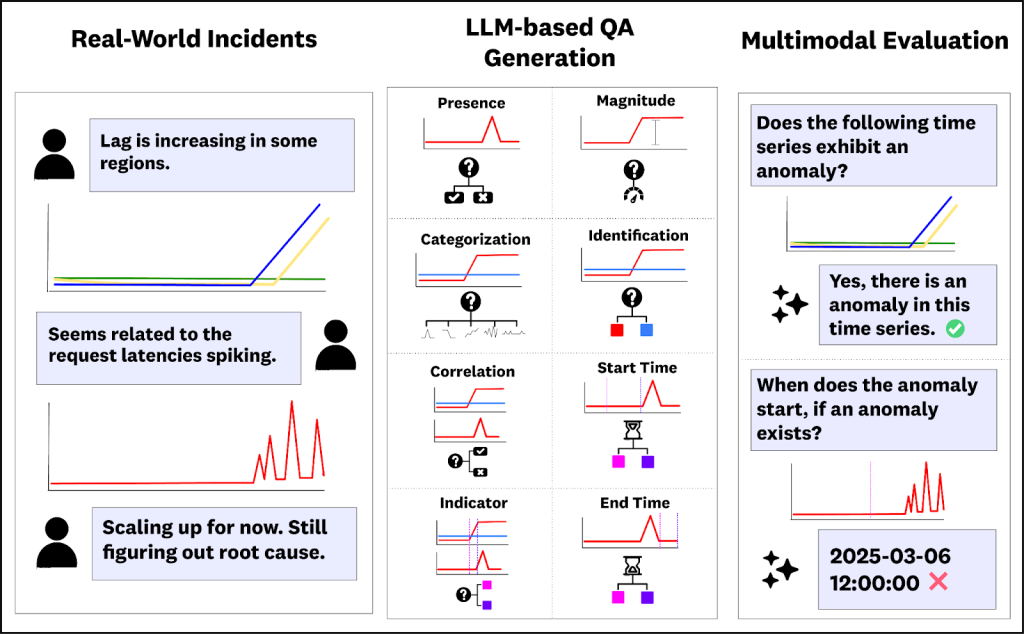
To this end, we’re excited to introduce the Anomaly Reasoning Framework Benchmark (ARFBench), a TSQA benchmark derived from real internal incidents at Datadog, using Datadog’s own internal telemetry (Figure 1). In this blog post, we’ll present three key takeaways from our benchmarking experiments:
- Existing models struggle: Leading LLMs, vision-language models (VLMs), and time series foundation models (TSFMs) have substantial room for improvement on ARFBench.
- Hybrid models help: We introduce a new hybrid TSFM-VLM model that yields comparable overall performance to top frontier models on ARFBench, demonstrating promising new approaches to TSQA modeling.
- Human–AI complementarity: We observe markedly different error profiles between our top TSFM-VLM model and human experts on ARFBench. These results suggest that their strengths are complementary. We introduce a model–expert oracle that establishes a new superhuman frontier for LLMs, VLMs, and TSFMs.
ARFBench: Using real-world incident data to create a TSQA benchmark
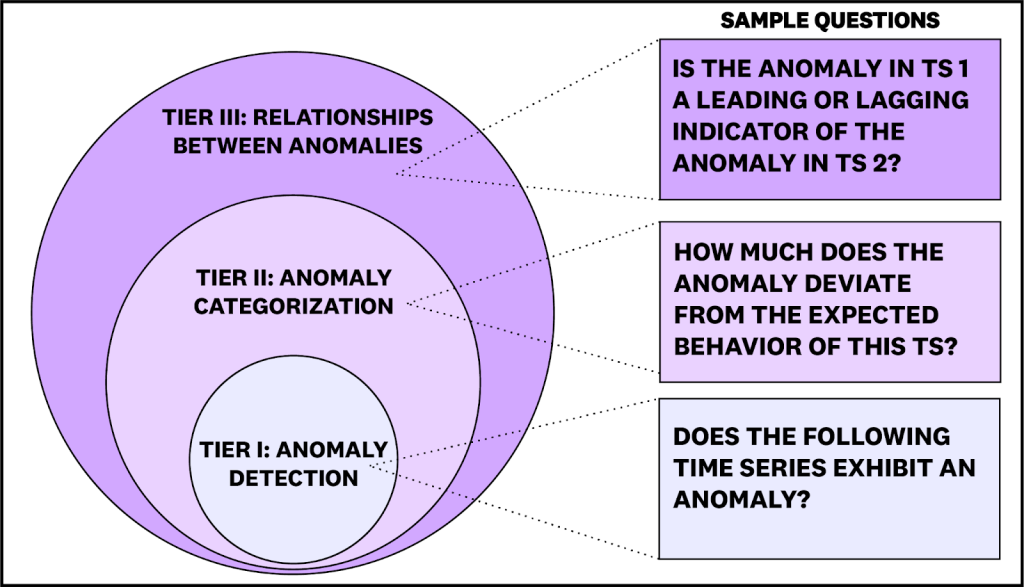
ARFBench is a TSQA benchmark based on real incidents internal to Datadog, using our own internal telemetry. Compared to existing benchmarks, ARFBench differs in three key aspects. First, it uses real time series data from production systems. Second, each question-answer (QA) example is grounded in expert annotations and additional context. And third, tasks are designed to test compositional reasoning: questions are organized into three tiers of increasing difficulty, with higher-tier tasks depending on correct reasoning on lower tiers (Figure 2).
ARFBench consists of 750 QA pairs drawn from 142 time series and 63 incidents. Time series in ARFBench have a maximum of 2283 variates (or dimensions) and 40k time steps, which present a challenging setting for context-limited models.
To create ARFBench, we built a VLM pipeline for extracting the time series widgets from internal incident discussion threads to help generate and filter question-answer pairs. We then manually verified every generated question for correctness and privacy concerns, and threw away questions that we found unsuitable.
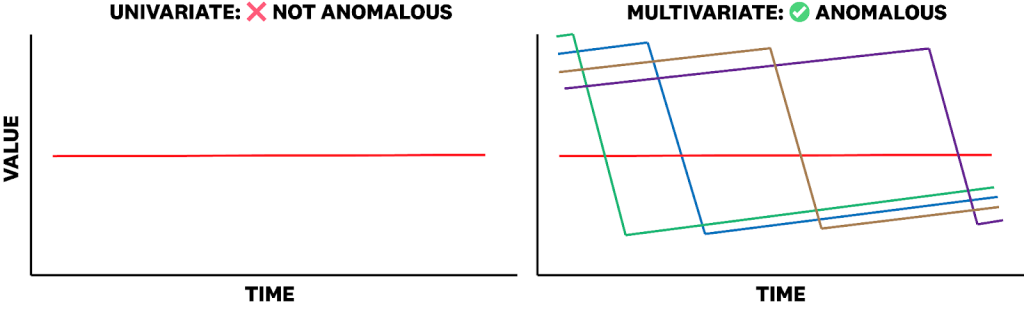
Reasoning about time series and anomalies requires usage of meaningful context across data modalities. ARFBench enriches time series with two types of context: time series captions, which describe what the time series represent, and multivariate groupings, which contextualize each channel relative to a larger relevant collection of time series channels. For instance, while it may not always matter that a single pod fails and restarts in a service, the combination of many pods failing and restarting simultaneously could indicate a significant anomaly. This level of complexity reflects real-world conditions that many existing unimodal, synthetic datasets fail to capture (Figure 3).
Leading LLMs, VLMs, and TSFMs have substantial room for improvement
We evaluated three categories of existing models on ARFBench:
- LLMs, which take time series as text input
- VLMs, which take time series plots as image input
- Time series LLMs. which use a time series encoder with an LLM backbone.
We compared the models to two human baselines: observability experts, and time series researchers without extensive observability experience. The human experts were evaluated on a randomly sampled 25% subset of ARFBench.
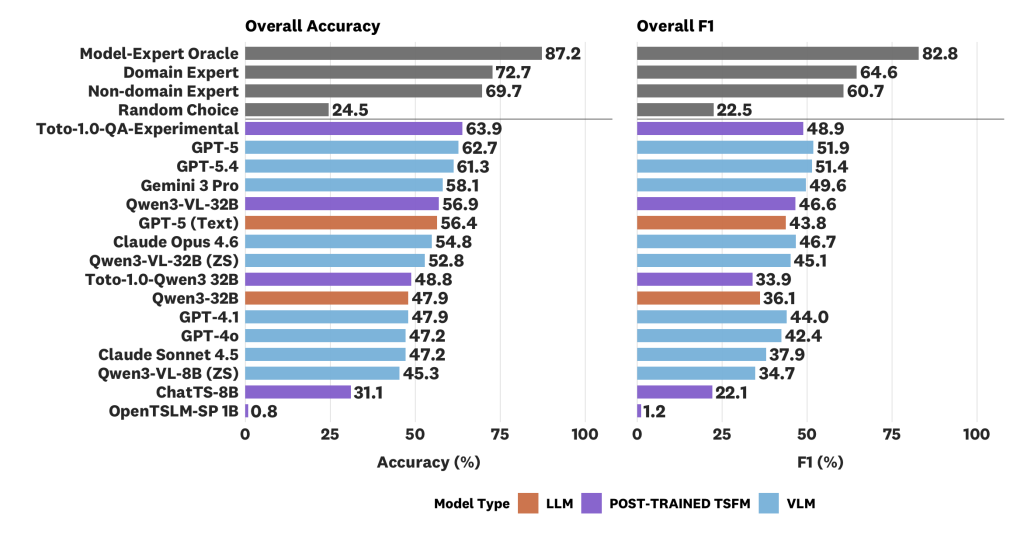
Among existing models, GPT-5 (VLM) yielded the top performance at 62.7% accuracy and 51.9% F1 (Figure 4). This is much higher than the random choice baseline at 22.5%, but still underperforms domain experts and is far below a model-expert oracle at 87.2% accuracy / 82.8% F1 (see below for further discussion). As expected, model performance tends to worsen as the tier difficulty increases.
We also observe several trends with our evaluations on ARFBench. Corroborating previous works in time series classification and QA such as Daswani et al. 2024, we find that VLMs outperform LLMs. The top proprietary models and open-source models also showed a substantial gap in performance. However, we find that some open-source models perform better than many older proprietary models or models from the Claude family.
Hybrid TSFM-VLM models show promise for specialized TSQA modeling
Though VLMs yielded the highest accuracy and F1 score among existing models, we found that plotting and input representation was a challenge for both VLMs and LLMs. For example, due to the high number of variates, we often could not plot the time series without repeating colors for or occluding different variates. This motivated a native time series approach alongside the VLM model in which we could utilize time series, plots, and text as joint input.
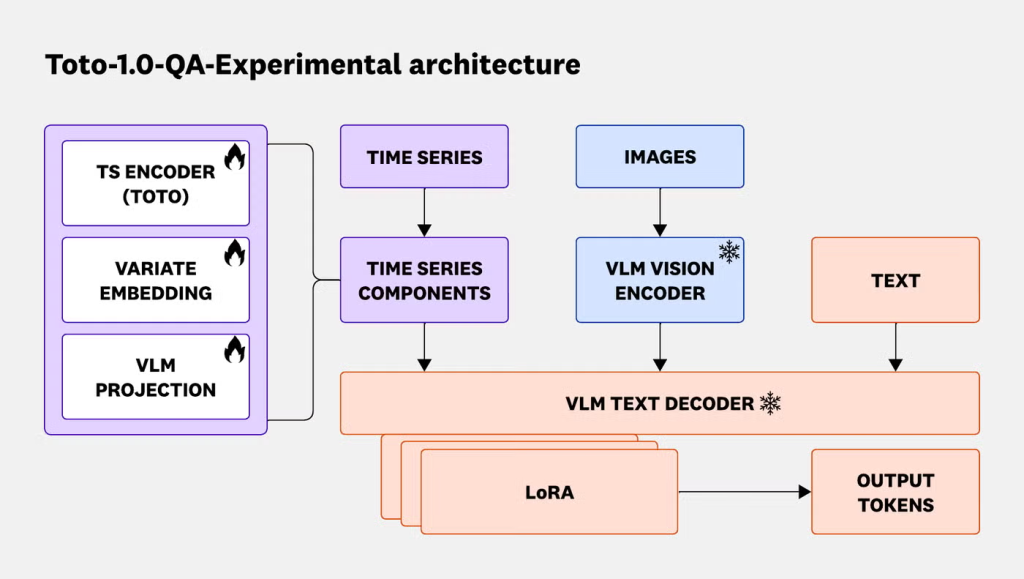
To test this, we trained a hybrid model (Figure 5) by combining Toto, a state-of-the-art observability TSFM, with Qwen3-VL 32B, a leading open-source VLM. We used both synthetic (Figure 6) and real multimodal data in a multi-stage post-training pipeline incorporating both supervised fine-tuning (SFT) and reinforcement learning (RL). The resulting model, Toto-1.0-QA-Experimental, yielded the top accuracy score of 63.9%, and comparable F1 to top frontier models (48.9%). In the Anomaly Identification task category, where a model selects anomalous variates in the time series, Toto-1.0-QA-Experimental outperforms all models by at least 8.8 percentage points in F1 and achieves best per-category accuracy, suggesting that TSFM-VLM modeling can highly benefit performance on particular tasks. Furthermore, Toto-1.0-QA-Experimental’s parameter count is several magnitudes lower than frontier models, thus providing potential efficiency gains at inference time.

We refer interested readers to the paper for more experimental details, error analysis, and case studies.
Domain experts complemented with models set a new superhuman frontier
The current aggregate gap on ARFBench between the best models (Toto-1.0-QA-Experimental & GPT-5) and the two human domain experts is only 8.8 percentage points in accuracy and 12.7 percentage points in F1. However, at the individual question level, we observe noticeably different behavior between GPT-5 and the human experts. GPT-5 answers 48% of questions correctly that both experts get incorrect; on these questions, the human experts tend to make errors in instruction-following or fine-grained perception. Meanwhile, at least one expert correctly answers 79% of questions that GPT-5 gets incorrect. On these sets of questions, model errors tend to involve hallucination and incorrect domain knowledge. We provide examples of both groups of errors in the paper.
Due to the large difference in error distribution, we hypothesize that when experts are complemented with models, their joint capability becomes much higher than any single expert or model alone. To establish this, we compute a model-expert oracle, a best-of-2 metric where an oracle perfectly chooses the best answer between the model and the expert, which yields 87.2% accuracy and 82.8% F1 on our data. This is far above existing model capabilities and sets a new superhuman frontier for LLMs, VLMs, and TSFMs to achieve.
What’s next: time series reasoning as a core component of agents
In the broader scope of incident response, ARFBench only contains questions targeting diagnosis and reasoning. However, we envision that strong diagnosis and reasoning abilities will play a large part in end-to-end agentic systems (e.g., SRE or incident response agents) that require time series reasoning as a subroutine in understanding the incident. While ARFBench can be used to evaluate time series agents, it is not currently a multi-turn benchmark. However, we believe that future agents and models that perform well on the single-turn ARFBench will ultimately perform better on end-to-end tasks.
Getting started with ARFBench
If you are interested in testing your model on ARFBench, you can find the benchmark and leaderboard, and model weights on Hugging Face, and the code on GitHub. To learn more, read our paper.