David Balkcom, Principal Engineer
When people first start exploring text analysis, they often land on a familiar visual: the word cloud. It is fast, intuitive, and useful for a rough first pass. But if your goal is to extract meaning, model relationships, and eventually support graph-native systems like Neo4j, a word cloud is only the beginning.
A more useful developer mindset is to treat text analysis as a progression:
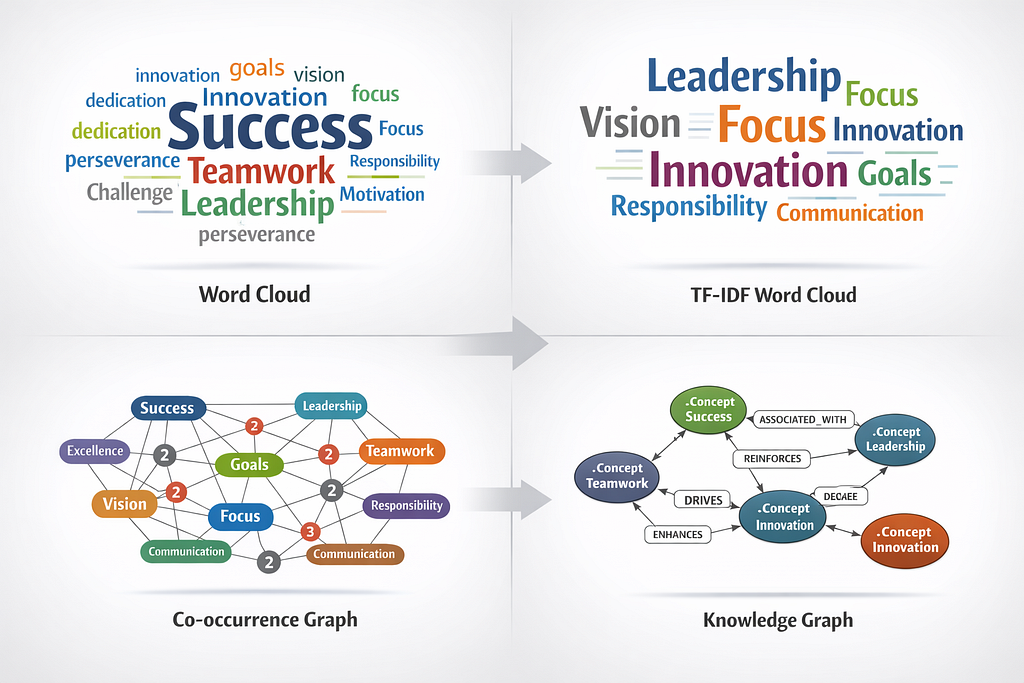
word cloud → TF-IDF weighting → co-occurrence graph → knowledge graph
That sequence matters because each step adds structure. A word cloud tells you what appears. TF-IDF starts to tell you what matters. A co-occurrence graph reveals what appears together. A knowledge graph gives those relationships durable meaning inside a system.
That shift is where NLP stops being decorative and starts becoming architectural.
Why word clouds are not enough
A basic word cloud is a frequency visualization. It makes repeated terms larger and rarer terms smaller. That is useful for orientation, but it does not tell you whether terms are related, important across contexts, or part of a reusable semantic structure.
In the session text, the example vocabulary included terms like success, excellence, commitment, teamwork, vision, leadership, and innovation. Those words work well in a visual cloud, but the cloud alone cannot tell you whether leadership is conceptually closer to vision or focus, or whether teamwork consistently appears with commitment and communication.
The limitation? A word cloud is descriptive, not relational.
Step 1: Word cloud as the UI layer
A standard word cloud is still useful. It gives you a quick surface view of a corpus and is especially helpful for demos, executive summaries, and exploratory work. In the original workflow, this was positioned as the baseline frequency visualization.
At this stage, you are answering a simple question:
Which terms show up most often?
That is a valid first question. It just is not the last one.
Step 2: TF-IDF as signal extraction
The next step is TF-IDF, or term frequency–inverse document frequency. Instead of only counting how often a term appears, TF-IDF helps weight how informative that term is relative to other documents.
In plain terms, TF-IDF reduces the influence of generic repeated terms and increases the influence of words that are more distinctive. In the session, this was framed as moving from raw frequency to importance weighting. That distinction is critical if you want something more meaningful than a visually appealing cluster of words.
Now the question becomes:
Which terms are actually informative, not just common?
That is the point where a text visualization starts to behave more like an analytic feature extractor.
Step 3: Co-occurrence graphs as the bridge to semantics
This is where things get more interesting.
A co-occurrence graph models how words appear together within a defined window. If two terms repeatedly occur near each other, you can represent them as nodes connected by an edge. Over time, repeated proximity increases the weight of that edge.
In the session text, this was correctly described as the bridge from NLP into graph thinking. That framing is exactly right. A co-occurrence graph is often the first usable semantic scaffold a developer can build from text.
Instead of asking only what appears, you now ask:
Which concepts travel together?
That question matters because most useful systems are not built on isolated terms. They are built on relationships.
For developers, this stage is also practical. Once you have nodes and weighted edges, you are no longer just generating a visualization. You are creating graph-shaped data that can be exported, transformed, persisted, and queried.
Step 4: Knowledge graphs as production direction
A co-occurrence graph is not yet a knowledge graph, but it is often the right starting point.
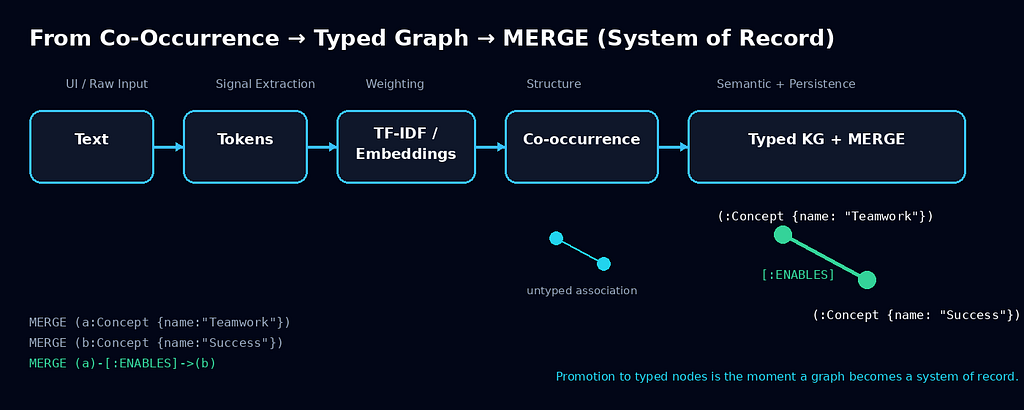
A knowledge graph goes further by attaching typed meaning to nodes and edges. In the original session, the example moved from simple concept words to JSON-style nodes and relationships, then to Neo4j Cypher statements such as MERGE operations between concepts like success, excellence, and teamwork.
That progression is important because it reflects a real production pattern:
- extract tokens
- weight terms
- model co-occurrence
- promote stable entities into typed graph nodes
- persist relationships as queryable edges
Once you do that, your graph stops being a picture and becomes a system of record for meaning.
A useful mental model for developers
The session text summarized this pipeline in a particularly strong way:
Word cloud as the UI or demo layer
TF-IDF as signal extraction
Co-occurrence graph as a proto-ontology or pre-graph structure
Neo4j knowledge graph as the durable semantic layer
That model is worth keeping because it separates stages by function, not by tooling hype.
It also prevents a common mistake: jumping straight into a graph database before doing the intermediate semantic work. If your text has not been normalized, weighted, and relationally examined, a graph database will not magically create meaning for you. It will just store noise more efficiently.
What this looks like in a real developer workflow
A good production-minded implementation usually follows this path:
- Normalize text
- Lowercase, remove punctuation, split into tokens, remove stop words, and optionally stem or lemmatize.
- Generate descriptive features
- Produce raw counts and TF-IDF scores to understand the corpus.
- Build co-occurrence structures
- Define a window size, count pair frequencies, and represent them as weighted edges.
- Promote concepts into graph entities
- Create node labels such as Concept, Term, Entity, or domain-specific classes.
- Persist into graph storage.
- Load nodes and relationships into Neo4j or a similar graph system using JSON import or Cypher.
- Iterate toward ontology
- Replace generic co-occurrence edges with more meaningful relationship types as the domain model matures.
This is the point where NLP starts aligning with semantic interoperability, graph analytics, and knowledge-driven application design.
Why this matters beyond demos
A word cloud is fine for a poster, a slide, or a quick visual. But a graph gives you something operational.
Once terms and relationships exist in a graph, you can start to:
- trace concept neighborhoods
- detect central terms
- identify clusters
- map semantic drift over time
- attach metadata and provenance
- connect unstructured text to structured domain models
That is the difference between visualization and infrastructure.
For developers working toward graph-native systems, the progression from word cloud to co-occurrence to knowledge graph is not just an NLP exercise. It is a practical on-ramp to building systems that can reason over meaning rather than merely display words.
If you are early in a text-analysis workflow, start with a word cloud. It is quick and useful. But do not stop there.
Try it — Want to build your own word maps quickly? Here is a simple generator in Python </>
Step Zero: Get wordcloud & matplotlib installed inside a python3 environment on your machine or virtual environment.
Step One: Run this to rapidly generate a word cloud:
# rapid wordcloud generator
from wordcloud import WordCloud
import matplotlib.pyplot as plt

text = """
fred wilma pebbles flinstone barney betty rubble bambam shmoo dino
"""

wc = WordCloud(width=800, height=400, background_color='white')
wc.generate(text)

plt.imshow(wc)
plt.axis('off')
plt.show()
The real value begins when you turn isolated words into weighted signals, then into relationships, and finally into graph-resident meaning. That is how you move from attractive text art to production-grade semantic architecture.
And that is the point where NLP starts becoming genuinely useful for developers…the point where text stops being descriptive — and starts becoming computable.
David Balkcom, MPH, is Principal Engineer and a senior Health IT developer at Quality Measurement Group. As a scientist, David works on 1) delivering clinical data interoperability, 2) implementing agentic AI loops for business, 3) tuning LLMs for healthcare, and 4) leveraging graph to automate data-analytic procedures. As an engineer, David translates subject matter expertise into domain-specific harnessing for AI agents to deliver deterministic responses for clinical and business analytics.
From Word Clouds to Knowledge Graphs: A Practical NLP Path for Developers was originally published in Towards AI on Medium, where people are continuing the conversation by highlighting and responding to this story.