As agents start changing software, they need a way to verify their work that includes traces, evals, feedback, and APIs. This is where Phoenix goes next — not the next release, but what this product becomes.
Observability was built for a world where humans did the reasoning. A human deployed code, reviewed traces, triaged alerts, and diagnosed failures. The tooling reflected that workflow: dashboards, filters, alerts, and evaluation pipelines. All of it assumed a human in the loop.
That assumption is rapidly breaking. Agents are becoming operators, too. They write code, change prompts, call tools, and modify systems. But they cannot work from tools designed only for human inspection. They need usable context: traces, evals, feedback, experiments, and annotations they can query, interpret, and act on.
That is what we are building with Phoenix: not just observability for humans, but a context platform for humans and agents to build great AI-native software together.
TL;DR
- Coding agents need feedback loops to verify whether their changes actually improved system behavior.
- Traces, evals, experiments, and feedback are becoming the verification layer for agentic systems.
- Context cannot live only in dashboards; it needs to be accessible through APIs, CLIs, and agent-facing interfaces.
- The goal is to close the loop so agents can self improve: trace, eval, diagnose, fix, and rerun
- We believe AI observability is evolving into a context platform where humans and agents will debug and improve systems together.
The evolution of software engineering
Two things changed at once.
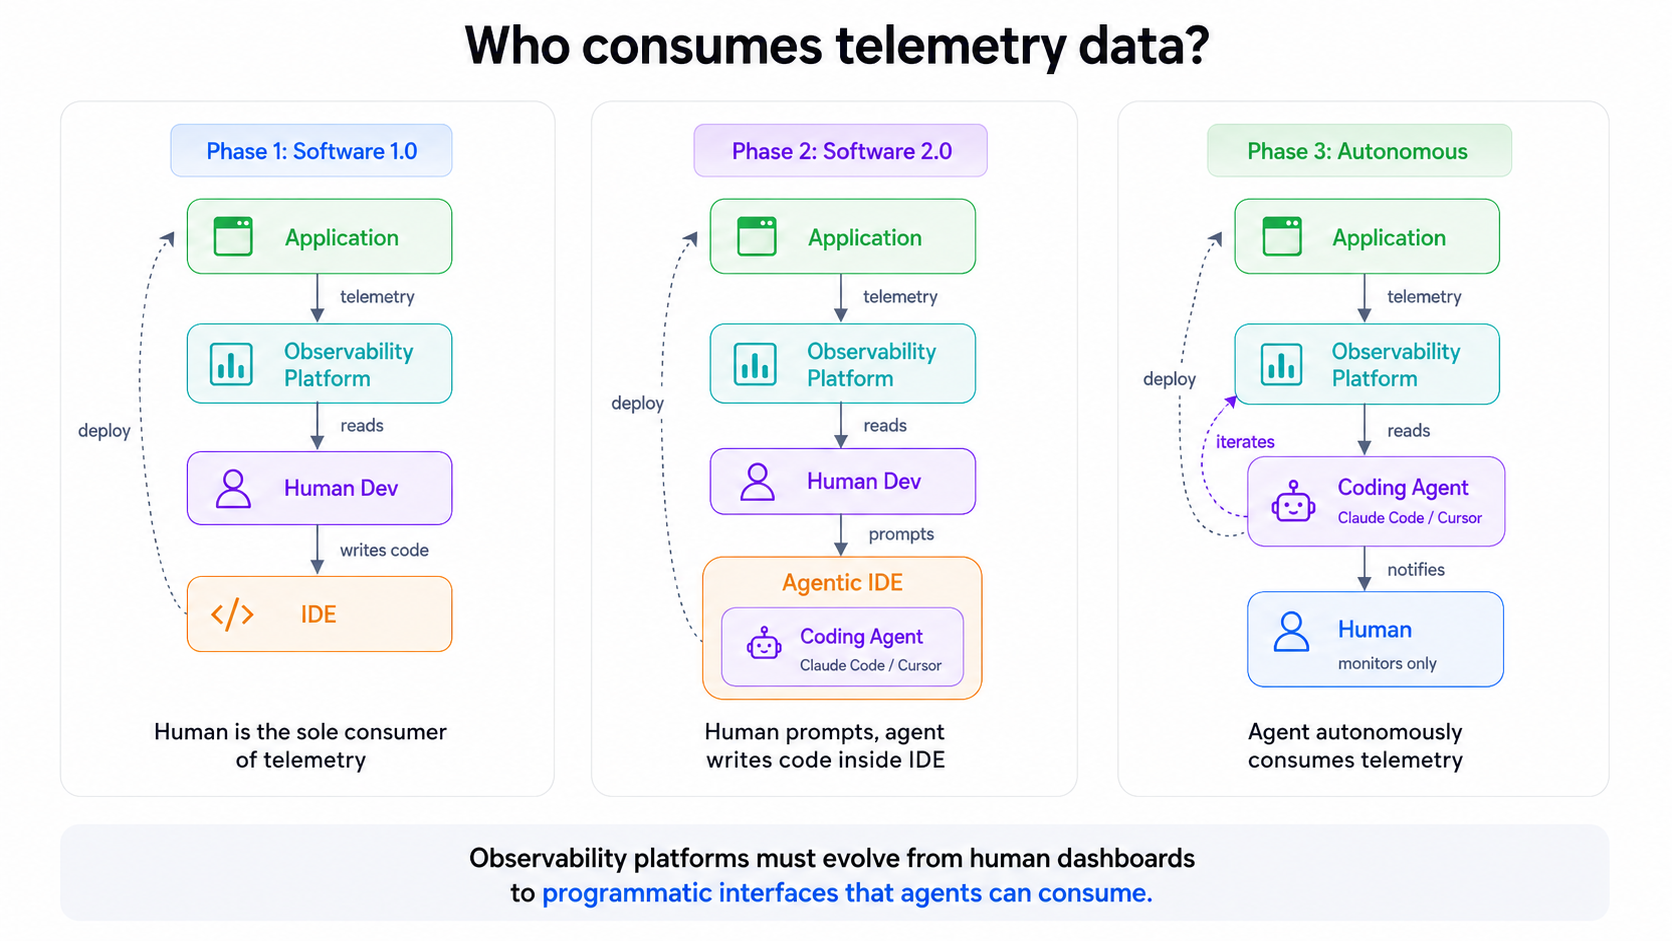
First, agents started writing and modifying a lot of code. Six months ago, most of us coded by hand with occasional AI assist. Now, many of us are running multiple agents in parallel, and stepping in only when careful scrutiny is needed. But the infrastructure around these workflows hasn’t fully caught up. A coding agent can generate changes, but it often has no effective way to determine whether those changes actually improved the AI system’s behavior.
At the same time, AI-native software is increasingly becoming the norm. Today’s software involves more than just code. You have code, prompts, and model weights. In these systems, you can’t review behavior before it runs. You can only observe it after.
For agents to close the loop, they need verification. For humans to trust agent-generated changes, those agents need to produce evidence and share context: traces, eval results, experiment comparisons, and failure examples. That evidence can’t just live in dashboards. It needs to be available through programmatic interfaces like APIs, CLIs, and other agent-accessible endpoints so agents can inspect what happened, reason over failures, and prove whether their changes worked.
Why traces matter more when behavior is non deterministic
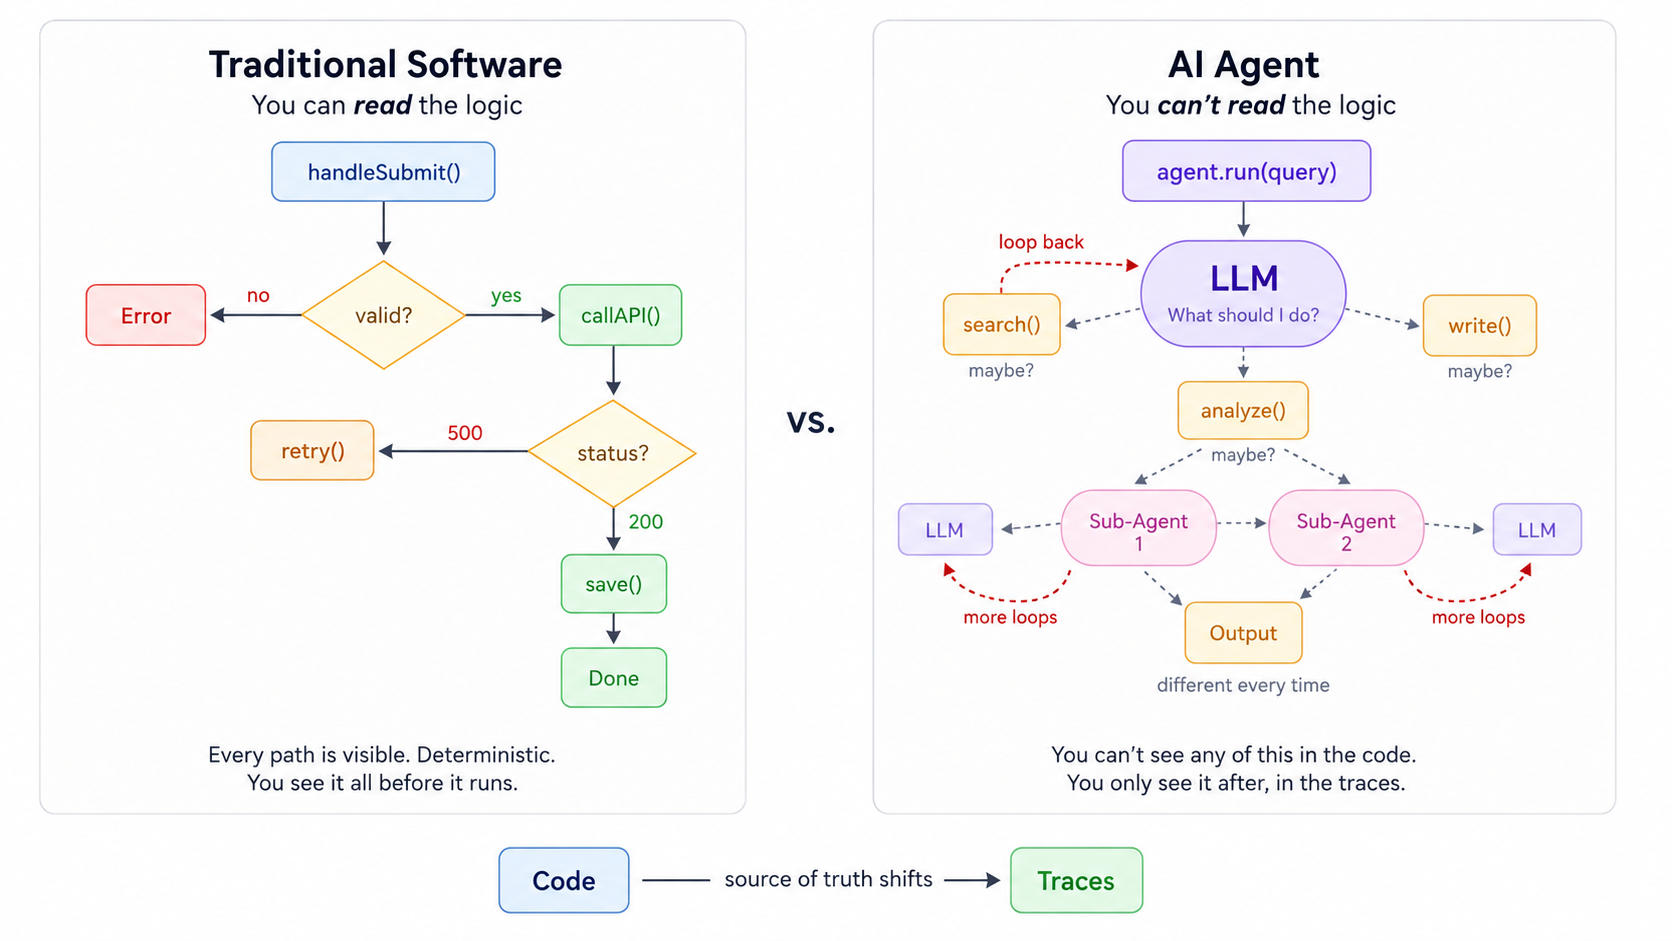
In traditional software, you can read the code. Every path a program might take is visible and deterministic; you see it all before it runs. In an agent, you can’t. Decisions happen inside the model at runtime and are different every time even when the context and prompts are exactly the same. You only see the outcome after it’s already been decided within the traces.
That means the source of truth has shifted from code to traces. Traces offer a record of each LLM call, tool invocation, routing decision, retrieved document, latency spike, and failure. They’ve become the substrate for evals, experiments, debugging, and regression analysis..
Without programmatic access to traces, an agent can change an agentic application but cannot reliably inspect whether the application behaved better after the change..
This is not abstract. When a coding agent produces a change to an agentic application, the only record of what that application did — its decisions, its tool calls, its outputs — lives in the traces. Source code tells you what could happen. Traces tell you what did. In a non-deterministic system, the latter matters more.
Phoenix is already vendor-agnostic with OpenTelemetry-based conventions that work across every major framework and provider. The traces are there. The question is what we do with them next.
From observability platform to a context platform
Every previous platform category was defined by what it observed: ML metrics, LLM inputs and outputs, agent trajectories, and so on.
The next useful layer is defined by what it enables with shared context humans and agents can both query and act on. It should hold the context including traces, evals, annotations, feedback, experiments, and expose it to both humans and agents so they can act on it.
Not an ML platform, LLM platform, or an agent platform. A context platform.
The distinction matters because it changes what we build. An observability platform optimizes for human consumption with dashboards, visualizations, and alerting rules. A context platform optimizes for both human and programmatic consumption. It should expose GraphQL APIs, CLI interfaces, MCP endpoints, and other surfaces where agents can query traces, correlate failures, and reason over eval results without a human intermediary.
We started building toward this with the Phoenix CLI earlier this year. That’s because AI coding assistants operate through the terminal and the filesystem. A browser-based UI is useful for humans, but inaccessible to an agent working in your IDE. Programmatic interfaces need to meet agents where they already are.
Context should lead to action
But a context platform that only serves dashboards is still waiting for a human to act. The next step is transforming context into action. We need to turn observability into something that doesn’t just describe what happened, but participates in fixing it.
This is the product thesis that drives everything that follows.
Agent evals
If traces are the source of truth and the platform’s job is to turn context into action, evaluation is where it starts.
The evaluation surface area is expanding
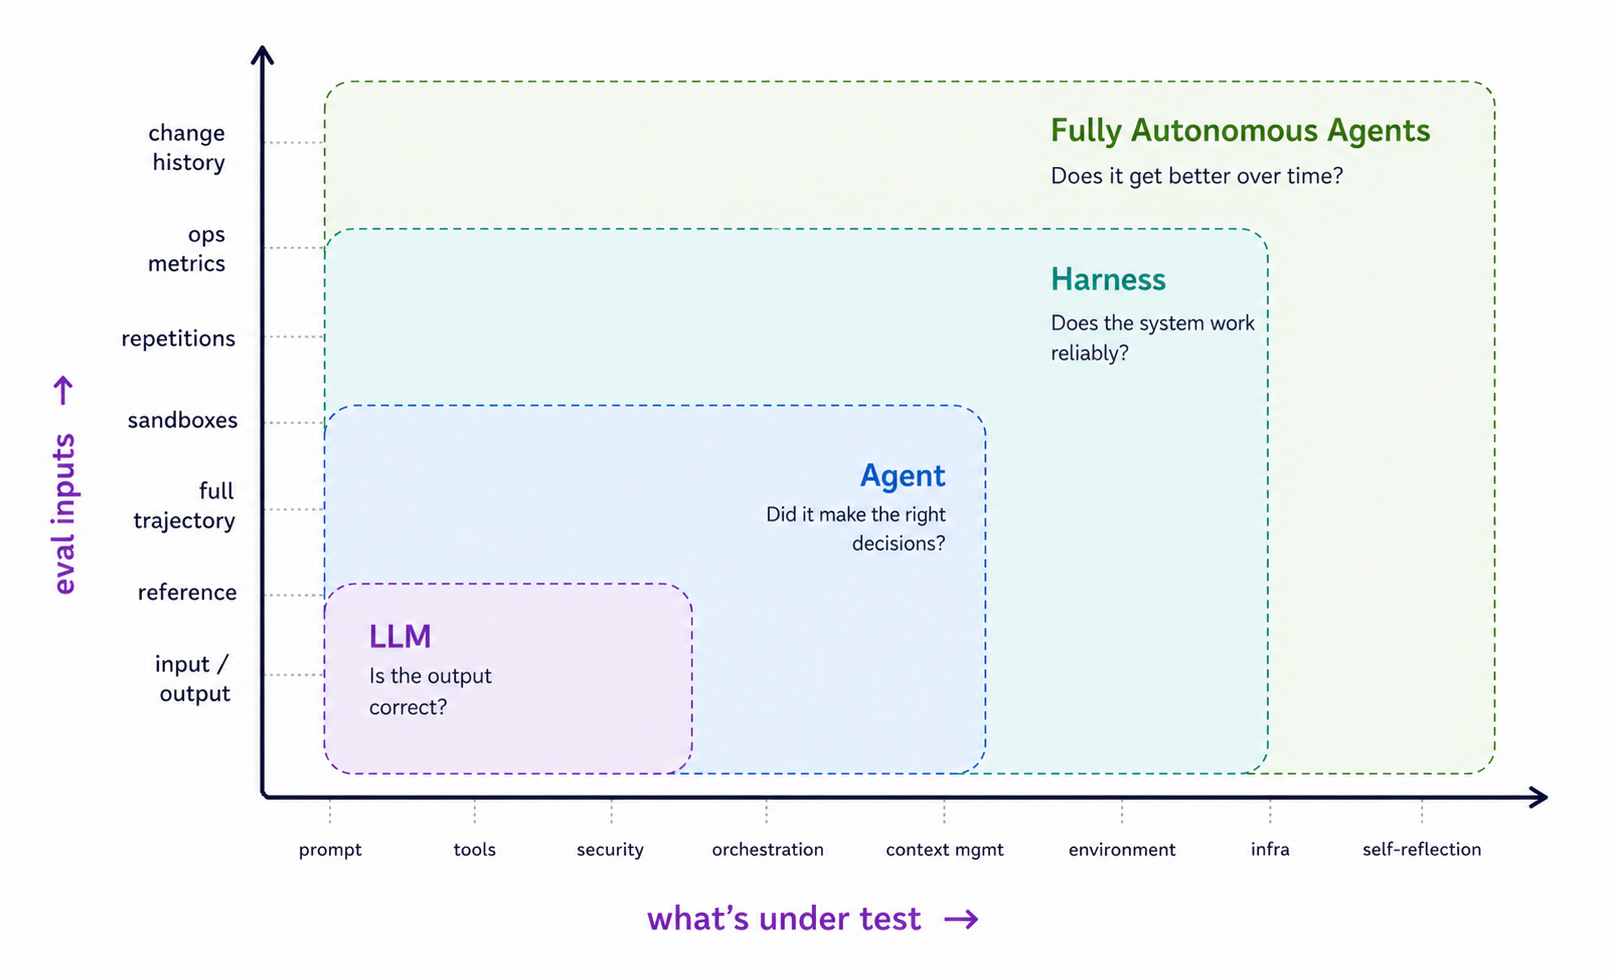
The evaluation problem is expanding along two dimensions simultaneously. On one axis, what’s being evaluated is growing from prompts and model outputs into tools, security, orchestration, context management, environment interaction, infrastructure, and self reflection. On the other axis, the eval inputs themselves are growing richer and evolving from simple input/output pairs to full trajectories, sandboxed execution, repetition analysis, ops metrics, and change history.
At the LLM level, the question is straightforward: is the output correct? But at the agent level, it’s more nuanced: did it make the right decisions? At the harness level, the question is more operational: does the system work reliably? And for fully autonomous agents, the question we’re ultimately building toward is self-improvement: does it get better over time?
The surface area of what needs evaluation is outpacing what a single LLM call can assess.
Moving from LLM-as-a-Judge to Agent-as-a-Judge
Evaluation strategies naturally evolve to match the complexity of what they measure. LLM-as-a-Judge emerged when generative outputs broke the assumption of a single right answer. That’s because LLM’s are flexible enough to capture subjectivity and customizable along the axes of quality teams actually care about.
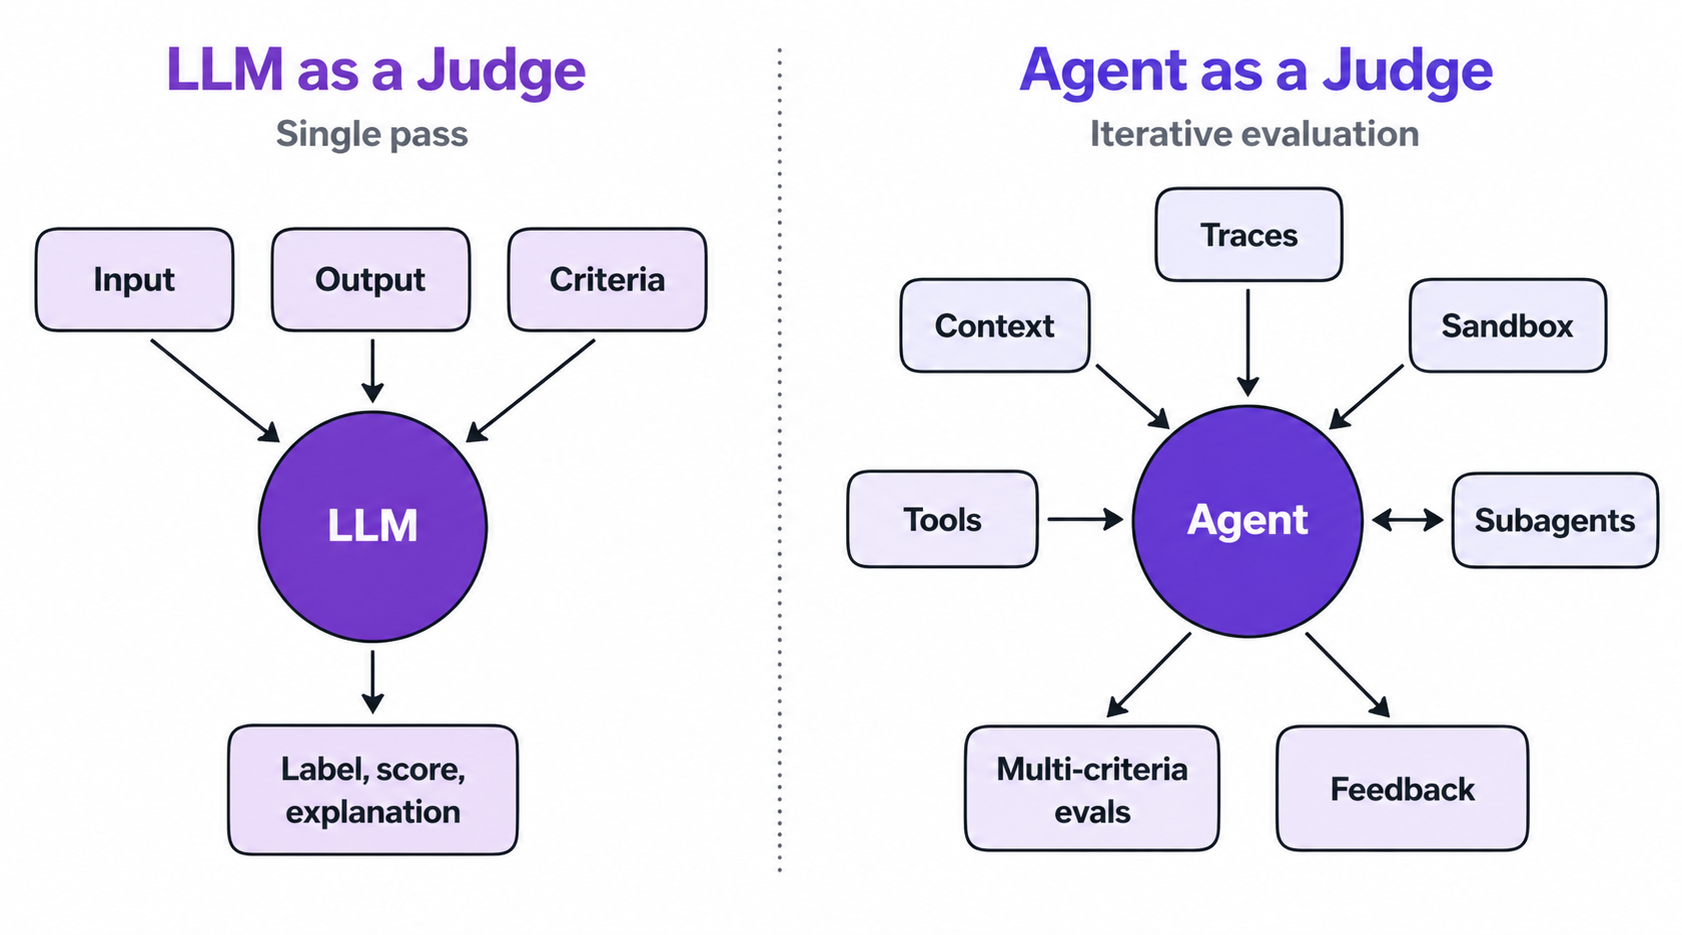
But this approach is shaped for outputs LLMs produce in isolation: input/output pairs that fit cleanly into a prompt. A single pass with input, output, criteria in; and label, score, explanation out.
Agentic systems are the next step. Agents don’t produce outputs in isolation; they interact with tools, environments and humans, operating in a long-running loop. Evaluation agents fit this shape because they share it: iterative reasoning, tool use, context management, sub-agents, the ability to run code and verify outputs. The same capabilities that make agents useful in production make them well-suited to evaluating other agents.
This is where Phoenix’s role as a context platform becomes concrete. The evaluator agent consumes the same traces, experiment data, annotations, and feedback the rest of the system produces. In that way, evaluation becomes a consumer of the platform’s context like everything else instead of a separate workflow.
Closing the loop: trace, eval, fix, rerun
Everything we’ve discussed from traces as source of truth to the context platform, agent evals, and sandboxes converges on a single architectural goal: pulling verification into the agent loop itself.
Building verification into an agent loop
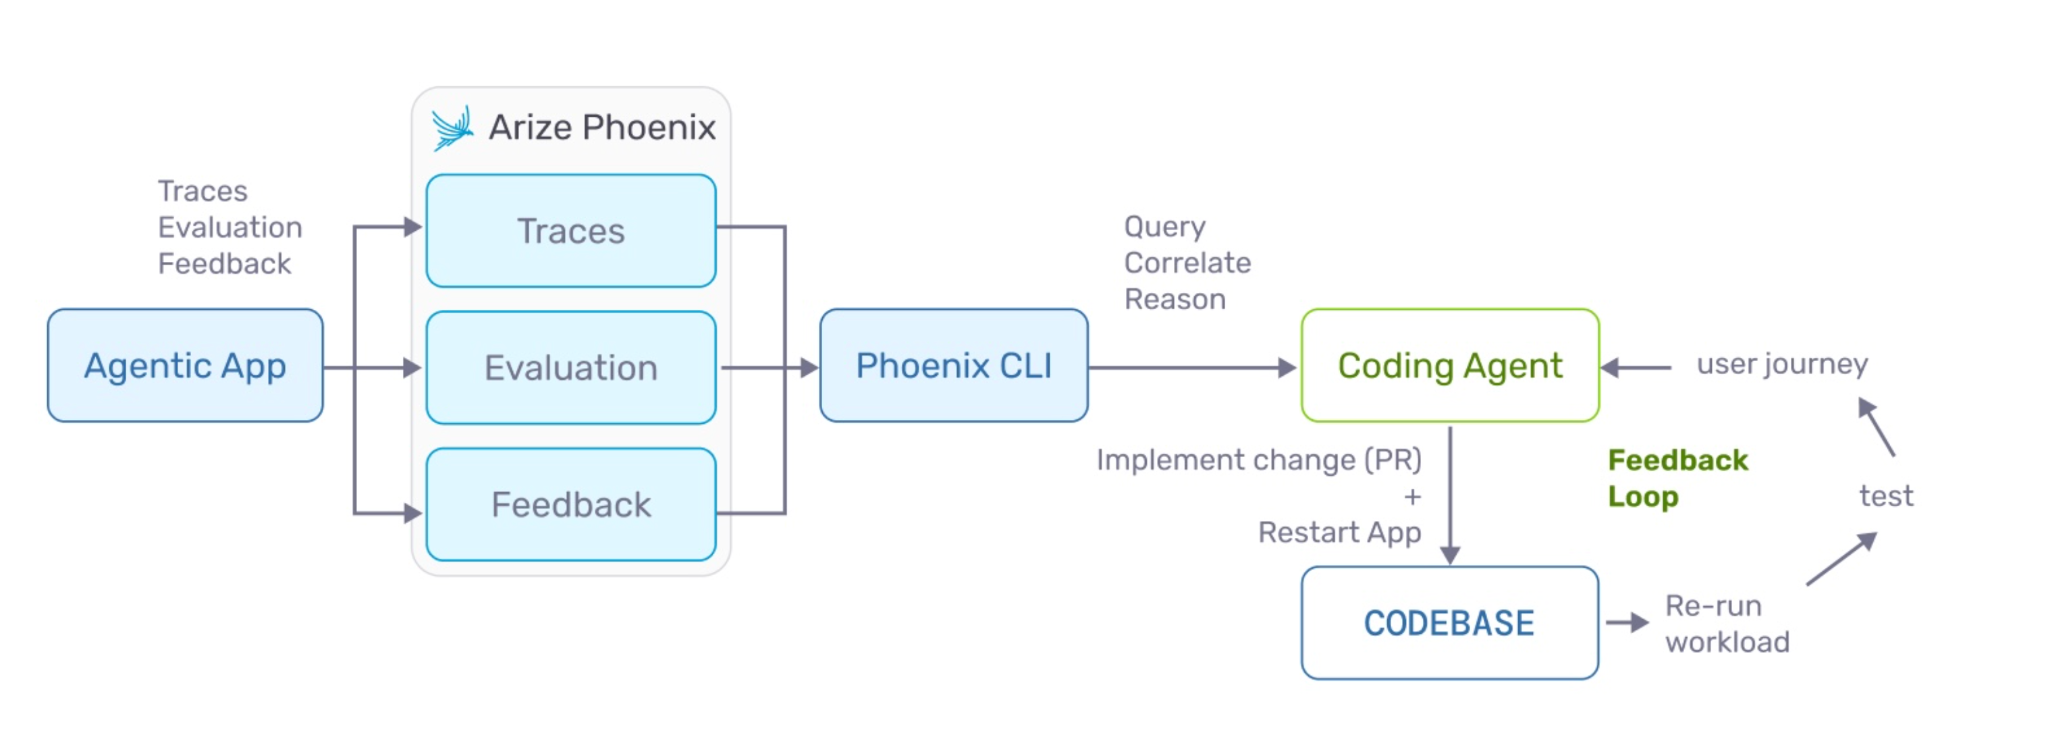
Here’s how it works concretely:
- An agentic application emits traces, evaluation results, and feedback into Phoenix.
- A coding agent like Claude Code, or Cursor queries Phoenix through the CLI or API to understand what went wrong.
- The coding agent correlates traces with eval failures, reasons over the context, implements a change, commits it, and re-runs the workload.
- The new traces flow back into Phoenix and the loop starts again.
The early pieces of this workflow already exist. The Phoenix CLI already supports px traces for fetching trace data, px api graphql for arbitrary queries against the Phoenix backend, and agent skills that teach coding agents how to interpret trace data and diagnose failures. The next step is connecting these pieces into a continuous loop.
Moving towards self-improving agents and self-improving systems
Agents are rapidly gaining the ability to evolve themselves. The next step is self-improving agents and self-improving systems. To get there, we need tools, guardrails, and triggers that initiate improvement cycles, context to reason over, and CI gates that enforce quality before changes ship.
The core principle: make coding agents prove their work. Don’t trust that an agent’s change is correct. Instead, we need to require that agents demonstrate correctness through traces, evals, and experiments. Phoenix becomes the verification layer in this loop, or the infrastructure through which agents produce evidence and humans audit it.
Agents debugging agents
This brings us to the deeper implication. If agents can query traces, run evals, and reason over feedback, then agents can debug other agents. The human doesn’t disappear. They supervise. But the diagnostic work shifts.
Active and passive modes
Phoenix sits at the center of two interaction patterns:
- In the active mode, a human directs an agent through Phoenix by querying traces, running evals, iterating on changes with the agent as a collaborator.
- In the passive mode, an autonomous agent or assistant works proactively to surface issues and propose changes while the human reviews.
Both modes require the same infrastructure: shared context, programmatic access, and mechanisms for agents to present evidence of their reasoning. The difference is who initiates and iterates.
Over time, more workflows may shift toward the passive model. But the platform needs to support both modes because trust is contextual: teams will delegate more when failure modes are well understood, and retain tighter control when the stakes are high.
Phoenix Intelligence
This is where the product work converges: Phoenix Intelligence, an agent layer built directly into the platform.
We envision two tiers:
- An assistant helps you along your AI engineering journey. This includes human-in-the-loop collaboration for debugging, dataset generation, eval design, and experiment setup. It meets you where you are, whether you’re a PM exploring production data or an ML engineer optimizing retrieval.
- The experts autonomously work as specialized agents from our observability context. They research your use case, alert you about regressions, run evaluations, and surface insights continuously inside your observability platform.
Agents building agents, improving agents, observed by agents. The platform that holds the context is the platform that acts on it. That’s the thesis, and what we’re building.
Final thought: the dial of delegation
None of this means engineering is dead. In fact, it’s quite the opposite. As agents take on more of the verification work, what they can’t take on becomes more valuable: the judgment about when to trust them, what to delegate, and what to keep close.
The dial of delegation is a human decision. The teams that learn to turn it carefully by pulling back when the stakes are high and lean in when the patterns are well understood are the ones that will move fastest. Trust isn’t given to agents; it’s earned. The engineers who calibrate it well will define what their organizations can do.
Phoenix is an open source platform for agent development and evaluation. The CLI, tracing infrastructure, eval framework, and OpenInference conventions all ship in the open. What comes next builds on that foundation. If you’re thinking about these problems, we’d love to hear from you.
– The Arize Open Source Team
The post From observability to context: What’s next for Arize Phoenix appeared first on Arize AI.