Why ensemble spread, calibration, and distributional shape matter more than point accuracy — and how to turn uncertainty itself into a decision input.

Two mornings in March. Same wind farm. Same mean forecast.
On Day A, the ensemble of weather models is tightly clustered — fifty-plus NWP members agreeing within a narrow band. Expected afternoon output: 38 MW. Standard deviation: 3 MW.
On Day B, a front is approaching. The same ensemble — same models, same portfolio — spreads widely. Expected afternoon output: 38 MW. Standard deviation: 12 MW.
A point-forecast-driven optimizer sees these two days as identical. Same mean, same bid — 38 MW into the day-ahead auction, battery scheduled against the same price forecast.
By evening, Day A settles close to plan. Day B does not. Maybe output collapses to 18 MW and imbalance costs bite hard. Maybe it surges to 55 MW, and the excess clears at balancing market prices well below what intraday trading could have captured.
Neither outcome is the forecast’s fault. The forecast correctly said “38 MW, wide uncertainty.” The problem was that the uncertainty was discarded before it reached the decision.
This post is about putting it back.
Picking Up Where the Last Post Ended
The previous article argued that in a policy architecture, the forecast transforms from a point estimate feeding an optimizer to a distribution feeding a decision-maker. That claim deserves unpacking.
What does it actually mean to treat forecast uncertainty as a trading signal? What kinds of uncertainty matter? How does a policy use a distribution differently from how an optimizer uses a mean? And what has to change in the forecasting workflow to make this work?
These are the questions that separate a mature probabilistic forecasting system from a point-forecasting one with error bars bolted on.
What a Point Forecast Loses
A point forecast answers one question: what is the most likely outcome?
A decision-maker needs to answer a different question: what actions perform well across the range of outcomes that could actually occur?
The gap between these two questions is where uncertainty lives. And it is not just the width of the error bar. It is the shape.
Variance tells you how much the outcome might deviate from the mean. Higher variance generally increases the value of flexibility — holding storage capacity, spreading volume across market stages, waiting to commit until closer to delivery.
Skewness tells you whether surprises are likely to be one-sided. A wind forecast with negative skew (most likely high, occasionally very low) calls for different hedging than one with positive skew. The optimal bid curve is asymmetric when the distribution is asymmetric.
Tail probabilities tell you about extreme events. A five percent chance of near-zero production is not a number you can capture with an error bar — but it is the number that determines balancing market exposure and reserve requirements.
Temporal correlation tells you whether forecast errors at 14:00 and 18:00 are linked. If they are — and in weather-driven forecasts they usually are — your battery strategy has to price joint tail risk, not per-hour risk.
Spatial correlation tells you whether a bad hour for your wind farm is a bad hour for the whole zone. This determines whether your forecast error will be absorbed by favorable price movements (when your portfolio under-produces alongside everyone else) or compounded by adverse ones.
None of these live in a point forecast. All of them affect the decision.
Calibration: The Metric That Actually Matters
The forecasting community often measures success with MAE or RMSE. These are useful, but they measure how close the mean of the forecast is to what happens, not whether the distribution is trustworthy.
A forecast is calibrated when its stated probabilities match observed frequencies. When you say “eighty percent chance the output exceeds 30 MW,” the output should actually exceed 30 MW on roughly eighty percent of days when you make that statement. Calibration is directly testable. Reliability diagrams and probability integral transform (PIT) histograms both expose miscalibration.
A forecast is sharp when its distribution is concentrated. Narrow intervals, not hedged toward “anything could happen.” Sharpness is a useful property, but only if calibration holds. A forecast that says “output will be 38 MW, standard deviation 0.1 MW” is extremely sharp and extremely useless if the actual variability is 12 MW.
The standard diagnostic framework, formalized by Gneiting, Balabdaoui and Raftery [1], is: maximize sharpness subject to calibration. You want confident forecasts, but confidence that reality will honor.
The proper scoring rule aligned with this framework is CRPS — the Continuous Ranked Probability Score [2]. Unlike MAE, CRPS penalizes both miscalibration and over-hedging. A forecast that is consistently underconfident scores badly, and so does one that is overconfident. CRPS is to probabilistic forecasts what RMSE is to point forecasts — except it actually aligns with what matters when the downstream decision is probabilistic.
The practical implication: a model optimized for RMSE is not the same as a model optimized for CRPS. Training objectives determine which failure modes survive. If the downstream system needs a distribution, training on point-forecast losses leaves the distribution shape largely unmanaged. It is worth noting that this is not just a theoretical point: ECMWF’s operational AIFS ENS, put into production in 2025, is itself trained on a CRPS-based loss — not MSE — precisely because point-forecast losses produce overly smooth, underdispersive ensemble members unsuitable for probabilistic use.

From Distribution to Action
Consider three distinct ways a policy can use distributional information that a point forecast cannot provide.
1. Flexibility pricing. The option value of storage is higher under wider uncertainty. If you are highly confident in a tight distribution, committing battery capacity to an evening peak is a reasonable bet. If the distribution is wide, the same commitment foregoes more optionality — and the policy should either hold capacity or split dispatch across stages. Uncertainty itself becomes a price signal, not for the commodity, but for flexibility.
2. Asymmetric bidding. European imbalance settlement is asymmetric around system direction, not around your own position. Under single-pricing regimes — the direction of the EBGL harmonisation and the design used in Germany, Belgium, and Ireland — one imbalance price applies per settlement period, with its sign set by whether the system is long or short; BRPs whose imbalance helps restore balance are rewarded, while those who aggravate it are penalized. Under dual-pricing regimes (France, partially the Netherlands), the asymmetry is explicit: different prices apply for imbalances that align with versus oppose the system’s direction. In either design, when your forecast distribution is skewed, and pricing is asymmetric around system state, the optimal bid is neither the median nor the mean — it is a quantile chosen to balance the two-sided risk. A point forecast has no way to express this. A distributional forecast lets the policy solve for it directly.
3. Scenario-based dispatch. Rather than optimizing against a single forecast, a policy can sample scenarios from the distribution, evaluate candidate actions against each, and select the action that performs well on average — or in the worst X percent (CVaR-style). This is standard in stochastic programming [3], but it requires a faithful distribution to sample from. Garbage-in scenarios produce garbage-out decisions. The quality of scenario generation — including cross-variable and cross-time dependencies — is often the binding constraint on stochastic optimization in practice.

These three mechanisms share a pattern: the policy acts on the shape of the uncertainty, not on the mean plus an error tolerance. When uncertainty changes, the action changes — even if the mean forecast does not.
Spatial and Temporal Structure
There is a subtler layer. Real portfolios are not single assets at single hours. A wind farm produces across twenty-four hours with correlated errors. A portfolio of wind farms has correlated errors across locations. A hybrid portfolio has wind, solar, and storage with different uncertainty structures interacting.
For a decision policy, what matters is the joint distribution — not just the marginal distribution of each hour or asset.
Two examples make this concrete.
Temporal correlation. Suppose your wind forecast errors at 14:00 and at 18:00 each have a 10 MW standard deviation. If those errors are independent, the combined standard deviation across the two hours is √(1⁰² + 1⁰²) ≈ 14 MW. If they are perfectly correlated — which they often are, because the same weather system drives both — the combined standard deviation is 20 MW. Your battery strategy and balancing exposure differ substantially between those two cases, even though the per-hour marginals are identical.
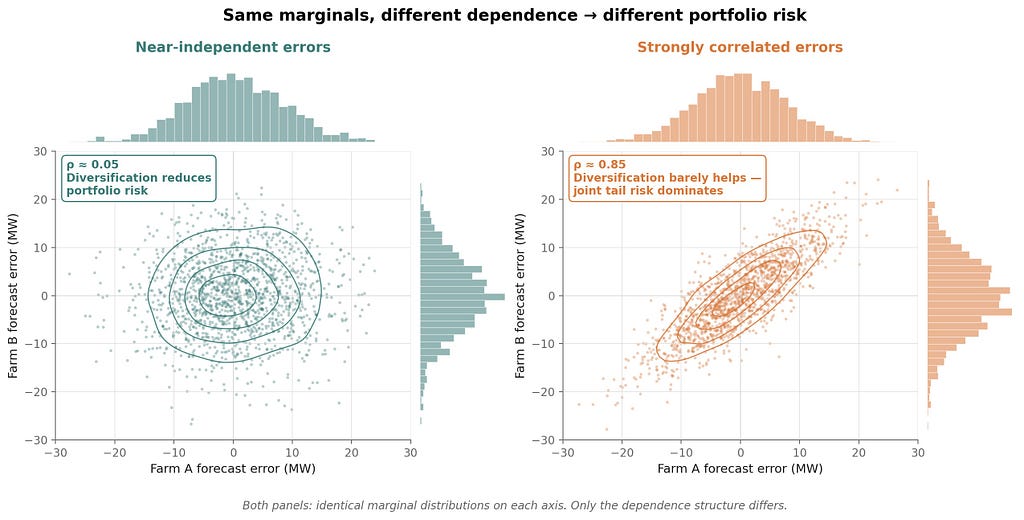
Spatial correlation. You own two wind farms, 30 km apart. Each has 8 MW forecast uncertainty. Are those errors correlated? If yes, your portfolio-level uncertainty is barely reduced by diversification. If no, portfolio risk drops substantially. The answer depends on the weather regime — and a well-constructed probabilistic forecast should tell you, not just the marginal distributions at each site.
Getting joint distributions right is hard. It often requires ensemble-based methods that preserve scenario consistency, or copula-based post-processing that models dependence structure explicitly [4]. It is not a feature most off-the-shelf forecasting tools produce by default. But for portfolio-level decisions, it is the layer that matters most.
What Changes in the Forecasting Workflow
If you are maintaining a point forecasting system today and want to evolve it into a probabilistic one that can feed a policy, the changes are concrete.
Change 1: The training objective. Models trained on MSE or MAE produce point forecasts. To produce calibrated distributions, the objective itself needs to reflect the distribution — quantile losses for quantile regression models, CRPS-based losses for ensemble models, negative log-likelihood for parametric distributional outputs. The architecture of the forecast model matters less than the loss it is optimizing.
Change 2: The ensemble construction. Ensembles should be built to span the range of plausible outcomes, not to average toward a best guess. This means preserving NWP member diversity, including model structure uncertainty where possible (not just parameter uncertainty), and resisting the temptation to “clean” ensembles by pulling in outliers.
Change 3: Post-processing for calibration. Raw ensembles from physical models are usually miscalibrated — typically underdispersive. EMOS (ensemble model output statistics) and BMA (Bayesian model averaging) are standard techniques [5] to re-calibrate without flattening the information content. This step is often skipped in production systems; it should not be.
Change 4: The evaluation metrics. Dashboards tracking MAE and RMSE need to be supplemented — or, for some use cases, replaced — with CRPS, reliability diagrams, and sharpness plots. What you measure is what you optimize for, explicitly or implicitly.
Change 5: The interface to the policy. The forecast should deliver samples, quantiles, or full parametric distributions — not a mean with a confidence interval tacked on. The policy’s ability to act on uncertainty is bounded by how much uncertainty structure the forecast actually communicates.
None of these are research frontiers. Probabilistic electricity forecasting has been an active field for over a decade — GEFCom 2014 was a watershed for the discipline [6], and mature methods exist for wind, solar, load, and price. The gap is not in the science. It is in deployment. Many operational forecasting systems in industry still treat probabilistic outputs as a nice-to-have annotation on a point forecast rather than the primary product.
Why This Is Hard to Sell Internally
There is a political dimension worth naming. Point forecasting has a clean KPI: MAE went down, the model is better. Probabilistic forecasting introduces metrics that are harder to communicate — reliability, sharpness, CRPS — and improvements in those metrics do not always correlate with MAE.
A forecasting team can demonstrate a half-point MAE improvement and claim a win. Claiming a “better calibrated” forecast is a harder story to tell a CFO who wants a revenue number.
The revenue number is there, but it shows up downstream, in the policy. A well-calibrated distribution lets the policy price flexibility correctly, size bids in line with risk tolerance, and avoid both over-commitment under uncertainty and under-commitment under clarity. The revenue lift is real, but it is attributed to the trading system — not to the forecast that made it possible.
This is another reason the pipeline architecture persists: it makes each component’s contribution measurable in isolation. A policy architecture makes the joint system the unit of measurement. That is a harder internal sell, even when it is the right one.
Where the Forecast Fits in a Policy World
Returning to the structural point from the previous post: in a policy architecture, the forecast is not the driver — the decision loop is. But the forecast is the sensory input that makes the loop possible.
A policy without a good forecast is flying blind. A forecast without a policy is producing information that nothing consumes. The two systems are complements, not substitutes — and the pairing works only if the forecast delivers the kind of information the policy can act on.
Point accuracy is necessary. Distributional fidelity is what turns accuracy into revenue.
The next post in this series moves from the asset level to the portfolio level — what happens when you stop thinking about single wind farms and start thinking about the capture price dynamics that emerge from spatial and temporal correlation in large renewable fleets. That question sits at the intersection of uncertainty, market structure, and portfolio design, and it is where much of the current revenue erosion in European renewables is concentrated.
Next in the series: “Capture Price Risk and Spatial Correlation in Renewable Portfolios” — why capture prices fall faster than market prices, how spatial correlation compounds the problem, and what portfolio-level decision architectures can do about it.
This post is part of a series: AI Systems Architecture for Multi-Stage Electricity Markets.
References
[1] Gneiting, T., Balabdaoui, F., & Raftery, A. E. (2007). Probabilistic forecasts, calibration and sharpness. Journal of the Royal Statistical Society: Series B (Statistical Methodology), 69(2), 243–268.
[2] Gneiting, T. & Raftery, A. E. (2007). Strictly proper scoring rules, prediction, and estimation. Journal of the American Statistical Association, 102(477), 359–378.
[3] Morales, J. M., Conejo, A. J., Madsen, H., Pinson, P., & Zugno, M. (2014). Integrating Renewables in Electricity Markets: Operational Problems. Springer.
[4] Pinson, P., Madsen, H., Nielsen, H. A., Papaefthymiou, G., & Klöckl, B. (2009). From probabilistic forecasts to statistical scenarios of short-term wind power production. Wind Energy, 12(1), 51–62.
[5] Gneiting, T., Raftery, A. E., Westveld, A. H., & Goldman, T. (2005). Calibrated probabilistic forecasting using ensemble model output statistics and minimum CRPS estimation. Monthly Weather Review, 133(5), 1098–1118.
[6] Hong, T., Pinson, P., Fan, S., Zareipour, H., Troccoli, A., & Hyndman, R. J. (2016). Probabilistic energy forecasting: Global Energy Forecasting Competition 2014 and beyond. International Journal of Forecasting, 32(3), 896–913.
All diagrams in this article are original.
Forecast Uncertainty as a Trading Signal: Beyond Point Predictions was originally published in Towards AI on Medium, where people are continuing the conversation by highlighting and responding to this story.