The Problem That Took 50 Years to Name
Imagine trying to understand a city by only ever reading reports from one neighbourhood at a time. The traffic report covers the roads. The housing report covers buildings. The cultural report covers theatres and restaurants. Each one is thorough and carefully researched. But nobody has ever put them together into a single map that shows how the city actually functions as a living whole.
That is almost exactly how neuroscience has worked since the 1950s. One laboratory spends decades mapping how the brain processes faces. Another map's language. A third spends years on memory, another on motion detection, another on emotional responses. Each group builds its own models, collects its own specialised data, and writes software that solves one specific problem. The results are genuinely brilliant in isolation. But they do not fit together.
This fragmented approach has produced a specific and frustrating gap. If you want to understand what happens in the brain when a person watches a film, where someone is speaking, emotions are running high, music is playing, and faces are moving across the screen simultaneously, you are essentially stuck. No existing model was built to handle all of those things at once. The tools were never designed for the full richness of natural experience.
“Understanding how neuronal assemblies represent and integrate information to form a coherent model of the surrounding world remains a fundamental challenge.” — d’Ascoli et al., 2026
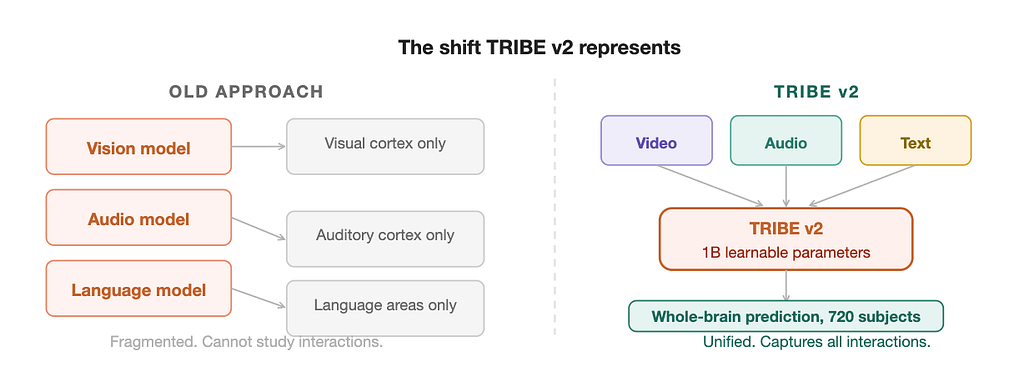
That sentence appears in the first paragraph of the TRIBE v2 paper, and it is not an empty preamble. It is a precise description of the gap the researchers are trying to fill. On March 25, 2026, a team at Meta’s Fundamental AI Research lab published their answer: a single foundation model called TRIBE v2 that takes in video, audio, and language simultaneously and predicts what the entire human brain will do in response. Not for one carefully selected participant. For 720 different people, across eight different scientific datasets, spanning over 1,000 hours of recorded brain activity.
The paper sets out four criteria that any serious brain foundation model must satisfy. Integration: the model must capture whole-brain responses across a wide range of conditions, not just one region or one task. Performance: it must reach or exceed the accuracy of traditional specialised pipelines. Generalization: it must work on stimuli, subjects, and tasks it has never seen before. Interpretability: it must provide tools for understanding how the brain organises its functions, not just produce predictions nobody can inspect. TRIBE v2 is their argument that all four can be achieved together.
What fMRI Measures and Why It Is Both Powerful and Limited
Before any model can be understood, the thing it is predicting needs to be clear. TRIBE v2 predicts fMRI signals, and if you have not encountered fMRI before, it is worth spending real time on what that means, because the nature of the measurement shapes everything that follows.
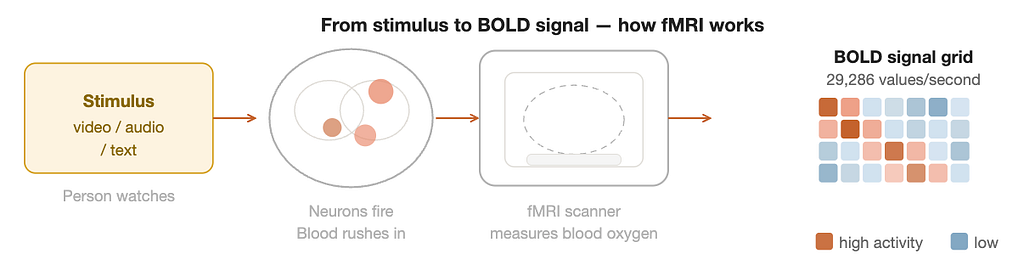
Your brain runs on electrochemistry. When a group of neurons becomes active, they consume oxygen and glucose at a higher rate than usual. The body responds by sending freshly oxygenated blood to that region, typically within a few seconds of the neural event. fMRI detects this change in blood oxygenation rather than measuring neural firing directly. The technique is called Blood Oxygen Level Dependent imaging, or BOLD, for that reason.
Think of it this way. The brain is a city, and neurons are individual cars. fMRI is not a camera that can see each car. It is a satellite that detects traffic congestion. When a neighbourhood has intense neural activity, blood rushes in, and the satellite registers a hotspot. You can infer that something important is happening there, but you cannot see the individual neurons or know exactly what they are doing at a millisecond level.
The scanner divides the brain into small cubes called voxels. Each voxel covers a few cubic millimetres and contains hundreds of thousands of neurons. The fMRI machine measures the BOLD signal in each voxel roughly once per second and records it as a number. Over the course of a scanning session, this produces an enormous dataset: a three-dimensional grid of numbers, updated hundreds of times, capturing where blood oxygen is high and where it is low at every moment.
TRIBE v2 works with two types of brain targets simultaneously. The first is the cortical surface, represented as 20,484 vertices spread across the outer layer of the brain. The second is subcortical regions, represented as 8,802 voxels covering eight deep brain structures, including the hippocampus, amygdala, and thalamus. Together, the model produces roughly 29,286 predicted values for every second of stimulus. That is not a rough summary. It is a vertex-by-vertex, second-by-second prediction of brain activity across the entire organ.
There is one built-in limitation that shapes everything: the blood oxygen signal lags behind neural activity by roughly five seconds. This hemodynamic delay is unavoidable. It means fMRI can never tell you about the millisecond-scale dynamics of neural computation. TRIBE v2 accounts for this by offsetting the fMRI timeseries by five seconds relative to the stimulus during preprocessing, so the model learns to predict where the blood flow will be five seconds after each moment of content.
The Eight Datasets: What 1,115 Hours of Brain Scans Look Like
A model that claims to generalise across the whole brain and across diverse people needs to be trained and tested on genuinely diverse data. The researchers assembled eight separate fMRI datasets, four for training and four held out exclusively for testing. Training data comes from “deep” studies with few participants scanned for many hours. Testing data comes from “wide” studies with many participants scanned briefly.
The four training datasets are: Courtois NeuroMod (4 subjects, 269 hours, movies and podcasts including six seasons of Friends), BoldMoments (10 subjects, 62 hours, short video clips with no speech), Lebel2023 (8 subjects, 86 hours, full narrative stories from The Moth podcast), and Wen2017 (3 subjects, 35 hours, silent video clips with no audio at all). That last one is deliberately included to train the model on video-only conditions.
The four testing datasets are: NNDb (86 subjects, 161 hours, full-length movies), LPP (112 subjects, 180 hours, the bilingual story Le Petit Prince), Narratives (321 subjects, 147 hours, spoken narrative stories), and HCP (176 subjects, 179 hours, a movie clip recorded at 7 Tesla rather than the standard 3 Tesla). The 7T scanner in the HCP dataset produces significantly better signal quality, which is why those results end up being the most informative about fine-grained individual brain differences.
None of the testing subjects, stimuli, or datasets overlap with the training data. The results reflect genuine generalisation, not memorisation.
All eight datasets went through a harmonised preprocessing pipeline. BOLD signals were mapped from volumetric scanner space onto the cortical surface using a 3mm ball-sampling method. Subcortical signals were extracted using the Harvard-Oxford atlas. All time series were z-scored within each session, linearly detrended to remove slow drift artefacts, and resampled to a uniform 1 Hz so that all datasets are comparable regardless of their original scan timing.
How TRIBE v2 Works: Every Stage Explained From Scratch
TRIBE v2 is built in layers. The first set of layers translates raw media into rich descriptions. A single learning layer finds patterns across time. A final personalisation layer adapts the output to each brain. Understanding each stage in order is the cleanest path through the architecture.
Stage 1: three frozen feature extractors. Raw video is just pixels. Raw audio is just a waveform. Raw text is just characters. None of these is directly useful for predicting brain activity. The researchers solve this by borrowing three separately trained AI models as permanent translators. The word frozen is important: these models do not learn anything new. Their weights never change. They function purely as sophisticated description engines that convert raw input into numerical vectors called embeddings.
For video, they use V-JEPA 2, Meta’s video understanding model. For each two-second window, 64 frames are fed in, and a 1,280-dimensional embedding comes out. For audio, they use Wav2Vec-BERT 2.0, producing 1,024-dimensional embeddings resampled to match the video rate. Unlike the other two, Wav2Vec-BERT has bidirectional context within its 60-second processing window, meaning it can look slightly ahead in time. For text, they use LLaMA 3.2 with 1,024 words of context per word, producing 2,048-dimensional embeddings that are rich with the semantic meaning of what is being said.
Stage 2: compressing and combining the three streams. The three embedding streams arrive in different sizes. Each passes through a compression layer that brings them all to 384 dimensions. The three 384-dimensional vectors are then concatenated into a single 1,152-dimensional representation at each two-second moment. This combined stream is what feeds the learning part of the model.
Stage 3: modality dropout. A practical model needs to handle situations where one or more inputs are unavailable. To build this in, each of the three modality streams is independently zeroed out with 30% probability during training, with the constraint that at least one modality is always present. This forces the model to work from any combination of inputs, not only when all three are available simultaneously.
Stage 4: the Transformer encoder, the only part that actually learns. The 1,152-dimensional stream feeds a Transformer with 8 layers and 8 attention heads. Before entering, learnable positional embeddings and a learnable subject embedding are added. The Transformer processes 100-second windows and can connect any two moments within that window through its attention mechanism. Narrative tension built over 40 seconds shapes how the model processes the second 41. This is where contextual dependency gets modelled. An adaptive average pooling layer at the output reduces the signal from two per second to one per second, matching the fMRI scan rate.
Stage 5: the subject block and the unseen subject layer. Every human brain has a slightly different spatial organisation. The subject block handles this with a separate output matrix for each participant, mapping the Transformer’s output to predicted BOLD values for that specific individual. For completely new subjects not in the training data, a separate “unseen subject” layer is used. During training, with 10% probability, the subject block is bypassed, and this unseen layer is used instead, forcing the model to maintain an accurate population-level prediction without any individual identity information.

individual brain.
Training Details and the Baseline That Makes the Comparison Fair
The training loss is mean-squared error between the model’s predicted BOLD signal and the actual recorded BOLD signal, with no additional regularisation. The optimiser is AdamW with a batch size of 16. The learning rate warms up linearly to 0.0001 over the first 10% of training steps, then decays according to a cosine schedule. Training runs for up to 15 epochs with early stopping: if the validation Pearson correlation score does not improve for three consecutive epochs, training stops. Feature extraction from the three pretrained models is done once and cached, which is why the full training run takes under 24 hours on a single V100 GPU despite the scale of the data.
When a new model claims to outperform the state of the art, the quality of the baseline it beats matters enormously. The standard approach in brain encoding research for decades has been a Finite Impulse Response model: linear regression mapping stimulus features to brain responses. The researchers did not compare TRIBE v2 against a weak version of this. They built what they call a Deep FIR model that uses the same pretrained embeddings from V-JEPA 2, Wav2Vec-BERT, and LLaMA 3.2 as TRIBE v2 itself. The only difference is that the Transformer is replaced by a linear convolutional layer spanning nine time points. This model is trained the same way, with multi-subject data, for up to 30 epochs. Any performance gap, therefore, reflects the architectural advantage of the nonlinear Transformer, not differences in input quality. That makes it a genuinely honest comparison.
How Well the Predictions Hold Up, and Why the Ceiling Has Not Been Found
The main accuracy metric throughout the paper is Pearson correlation R, which measures how well the predicted BOLD timeseries tracks the actual recorded one in each brain location. Values range from zero, meaning no relationship, to one, meaning perfect correspondence. In practice, even two recordings of the same person watching the same content will not correlate perfectly because biological noise is always present. So R values of 0.2 to 0.5 are genuinely good in this setting.
TRIBE v2 achieves above-chance predictions in a wide variety of cortical and subcortical regions across all four training datasets. Early visual areas reach approximately R = 0.38. Early auditory cortex reaches approximately R = 0.34. The multisensory temporal-parietal junction sits around R = 0.25, and the inferior frontal regions around R = 0.20. Subcortical regions like the hippocampus and amygdala consistently show correlations two to three times lower than the best cortical areas, which is expected because these deep structures respond to information that is not directly driven by the surface properties of the stimulus.
Across all datasets, TRIBE v2 significantly outperforms the Deep FIR linear baseline, with a false discovery rate corrected p-value below 0.0001 when comparing across subjects. The gap is consistent across all regions and datasets, not concentrated in any particular area.
The scaling law finding is equally important. When the researchers trained TRIBE v2 on progressively larger fractions of the Courtois NeuroMod dataset and measured accuracy each time, the result was a log-linear relationship with no visible plateau. As the amount of training data increases tenfold, accuracy increases by a fixed amount, and there is no sign that this curve is flattening. The model continues to improve across every data volume tested. This mirrors scaling laws seen in large language models and means that as neuroimaging repositories keep growing, TRIBE v2 is positioned to keep benefiting.
Predicting Brains It Has Never Met and Getting Better With a Little Data
The four testing datasets contain 695 people the model has never seen. Using only the unseen subject layer with no fine-tuning of any kind, TRIBE v2 predicts the average brain response of each testing cohort in a zero-shot manner. This group-level prediction is then compared against a useful benchmark called group-predictivity: for any participant in a study, their individual brain recording is one noisy sample of the underlying average response shared across people. You can measure how well one person’s recording predicts the rest of the group’s average, and that is their group-predictivity score.
Across all four testing datasets, TRIBE v2’s zero-shot prediction of the group average outperforms the group-predictivity of most individual subjects. The model’s prediction of what the average brain will do is closer to the actual average than any person’s recording typically is. The gap is largest in the HCP dataset, where the 7T scanner provides the best signal: TRIBE v2 reaches a group correlation of approximately 0.4, roughly double the median individual subject’s group-predictivity in the same cohort.
This is possible because individual brain recordings contain two things mixed together: the shared response to the stimulus, which is what we want to capture, and idiosyncratic noise unique to that person. TRIBE v2’s prediction apparently captures the shared signal while skipping the noise, producing something closer to the noiseless average than any single recording achieves on its own.
For situations where individual predictions matter rather than group-level ones, fine-tuning closes the gap. The model is given roughly half an hour to one hour of new data from a previously unseen person and allowed to adapt for a single epoch. The subject block for the new participant is initialised using low-rank matrix factorisation, specifically singular value decomposition with a bottleneck rank of 128, which dramatically reduces the parameter count for large testing cohorts. After this minimal fine-tuning, TRIBE v2 consistently reaches two to four times higher encoding scores compared to a linear model trained from scratch on the same limited data.
Running 30 Years of Visual Neuroscience in a Single Forward Pass
This is the section of the paper hardest to overstate the importance of. Once you have a model that accurately predicts brain responses, you can ask it questions that would otherwise require months of ethics approval, scanner booking, participant recruitment, and data processing.
The Individual Brain Charting dataset is a French initiative that scanned a small group of participants on over 60 different cognitive tasks using carefully controlled stimuli to create a comprehensive map of brain function. TRIBE v2 was never trained on any of these controlled tasks. All its training came from naturalistic movies and podcasts. Yet when the researchers fed it the same controlled stimuli and asked what the brain would do, the results matched the empirical findings with striking accuracy.
For the visual experiments, images from five categories — faces, places, body parts, written characters, and tools — were each presented for one simulated second with eight seconds between each image. A general linear model was fit to the model’s predicted BOLD timeseries to produce contrast maps using the same analysis pipeline as the actual IBC human study.
The temporal dynamics were correct first of all. After an image appears, the predicted BOLD response rises, peaks at five seconds, and decays back to baseline. This is the canonical hemodynamic response shape. The model learned this timing purely from the training data, rewarding predictions that respected it.
For faces, TRIBE v2 predicted strong activation in the fusiform face area (FFA), a region linked to face recognition since the 1990s. The spatial correlation between the model’s predicted map and actual human data was R = 0.64 (p = 2e-42). For places, it predicted the parahippocampal place area (PPA), R = 0.79 (p = 3e-79). For body parts, the extrastriate body area (EBA), R = 0.74 (p = 4e-63). For written characters, the visual word-form area (VWFA), R = 0.60 (p = 2e-36). Tools showed the weakest match at R = 0.12 (p = 0.03), still statistically significant but clearly less well captured.
These are four of the most replicated findings in visual neuroscience, each with a research history spanning decades. The model recovered all of them from scratch, without any training on controlled experiments of this kind.

the model’s predicted brain activation pattern matched real human data. The model was never trained on any of these
Finding the Language Network Without Being Told It Exists
The language experiments follow the same logic as the visual ones. TRIBE v2 was given stimuli from four IBC language tasks covering five different contrasts. Because the stimuli were originally in French, they were translated into English, converted to speech using a text-to-speech pipeline, and then run through a speech-to-text system to recover word timings. Both audio and text streams were fed to TRIBE v2 together.
When speech segments are contrasted against silence, the model predicts activation concentrated in the core language processing areas: associative auditory cortex area A5, the superior temporal sulcus, and Broca’s area. Spatial correlation with actual human data is R = 0.79, the strongest of all five language contrasts.
When speech is contrasted against natural sounds like bird calls and waterfalls rather than silence, a similar but slightly more selective pattern emerges, still centred on A5 and the superior temporal sulcus. This tests whether the model correctly identifies the language-selective response as being about linguistic content, not just the acoustic properties of speech. Spatial correlation R = 0.45.
The emotional pain versus physical pain contrast is where the results become particularly interesting. Sentences like “I feel depressed” are contrasted against sentences like “My foot hurts.” Both are syntactically simple. The difference is purely semantic: one requires understanding a mental state. TRIBE v2 correctly predicts higher activation for emotional pain in the temporo-parietal junction (TPJ) and the middle temporal gyrus (MTG), two regions associated with understanding others’ mental states and social cognition. Spatial correlation R = 0.50.
For sentences versus scrambled word lists (same words, random order), the model predicts stronger activation for the coherent sentence with higher left-hemisphere lateralisation, exactly consistent with the well-known left-dominant organisation of the language network in right-handed people. Spatial correlation R = 0.60. And for complex versus simple sentences, TRIBE v2 correctly predicts stronger Broca’s area activation for the syntactically demanding version, while semantic regions like TPJ respond more to the sentence-versus-word-list contrast instead. Spatial correlation R = 0.21, the weakest but still statistically significant (p = 4e-05).
The model correctly distinguished between semantic processing regions and syntactic processing regions, and correctly predicted left-hemisphere lateralisation for linguistic stimuli. None of these distinctions were in its training labels. They emerged from learning to predict naturalistic fMRI during movie and podcast watching.
The Hidden Discovery: Five Brain Networks That Appeared on Their Own
The in-silico experiments show that TRIBE v2 can reproduce known findings. But what has the model actually learned internally? To investigate this, the researchers applied Independent Component Analysis to the model’s final layer.
The final layer of TRIBE v2 is a large matrix that maps from the model’s internal latent space onto the cortical surface. Independent Component Analysis finds the directions in this space that vary most independently of each other. Think of it as asking: what are the most distinct patterns the model has organised its internal representations around?
With five components requested, the results were striking. Each component mapped cleanly onto a different well-known functional brain network. The five that emerged were the primary auditory cortex, the language network, the motion detection system, the default mode network, and the visual system.
The researchers confirmed this by comparing each component against cortical activation maps from Neurosynth, a database that aggregates results from thousands of published brain imaging studies and produces consensus functional maps for keywords like “language,” “visual,” and “motion.” Each of TRIBE v2’s five components showed high spatial correlation with exactly one Neurosynth map and low correlation with all the others.
These five networks are among the most replicated structures in all of human neuroscience, identified through careful experimental work accumulated over decades. TRIBE v2 recovered all five as a side effect of learning to predict responses to movies and podcasts. Nobody told that these networks exist. There are no labels in its training data pointing to them. The functional organisation of the cortex emerged from prediction alone. If an AI system trained purely on naturalistic prediction converges on the same functional architecture that experimental neuroscience discovered through decades of controlled studies, it is strong evidence that the architecture is real and not an artefact of how experiments are designed.
What Each Sense Contributes and Where They Meet in the Brain
The modality ablation study trained seven separate versions of TRIBE v2: one with only video, one with only audio, one with only text, and all four combinations of two or three together. Comparing these in each brain region reveals a clean topographic map of sensory dominance across the cortex.
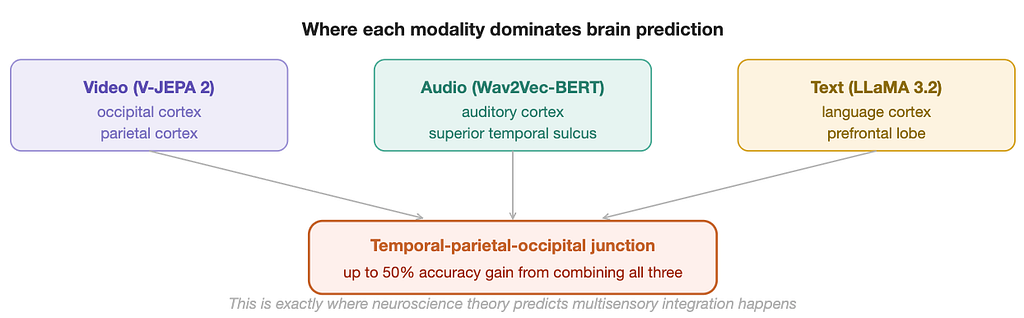
Video features dominate in the occipital and parietal cortices, the visual processing hierarchy. Audio features dominate near the auditory cortex in the temporal lobe. Text features, carrying the richest semantic information, dominate in the language cortex and large parts of the prefrontal lobe. Across the whole brain, video achieves the highest average encoding score of the three unimodal models, followed by audio, then text. This ordering reflects the fact that fMRI accuracy is heavily driven by early sensory areas, which respond more directly to perceptual input than to abstract meaning.
When the full multimodal model is compared against the best of its three unimodal counterparts in each brain region, the largest improvements appear around the temporal-parietal-occipital junction, with encoding score increases of up to 50% in that area. Smaller but meaningful gains also appear in the prefrontal cortex. These are precisely the regions that neuroscience theory, based on lesion studies and controlled imaging work, has long identified as critical for multisensory integration — where the brain stitches together sight and sound and meaning into a unified experience.
The researchers also created an RGB-encoded cortical map where red represents text encoding strength, green represents audio, and blue represents video. Areas encoded well by only one modality appear in the pure colour. Areas requiring two or more modalities appear in mixed colours: yellow for text plus audio, cyan for video plus audio, magenta for text plus video. Individual subjects show subtle but meaningful differences in the spatial organisation of these mixed-colour zones, visible in the per-subject maps published in the paper.
First Place Among 263 Teams, and What the Model Still Cannot Do
An earlier iteration of TRIBE v2 entered the Algonauts 2025 brain prediction competition, which challenged research teams worldwide to predict fMRI responses to naturalistic videos. At the competition's close, the leaderboard had 263 teams. TRIBE v2 placed first with a mean Pearson score of 0.2146, ahead of the second-place team (Schad et al., 0.2096), third place (Eren et al., 0.2094), fourth place (Villanueva et al., 0.2085), and fifth place (0.2055). The margin over second place is small at 0.005 but consistent across all four subjects in the competition, suggesting a genuine architectural advantage rather than variation on one participant.
The paper is unusually candid about what the model cannot do. Six limitations are worth understanding in full. First, fMRI is inherently slow. The blood oxygen signal lags neural activity by five seconds and updates only once per second, so the model can never tell you about the millisecond-scale dynamics of real neural computation. Second, only three senses are modelled. Touch, proprioception, balance, olfaction, taste, and the body’s internal signals are absent, which matters for studying embodied cognition. Third, the model treats the brain as a passive receiver of information. A brain that is deciding, planning, speaking, or moving is fundamentally different, and TRIBE v2 has nothing to say about active behaviour. Fourth, almost all participants are from Western, Educated, Industrialised, Rich, and Democratic societies, and brains shaped by different languages and developmental histories may be organised differently. Fifth, all participants are healthy adults, so the model says nothing about brain development, ageing, or clinical conditions. Sixth, even though the ICA analysis reveals interpretable representations at the network level, the mechanism behind any individual prediction remains opaque. You cannot yet look inside the model and understand why it predicts a specific activation pattern for a specific stimulus.
Why This Paper Deserves Your Attention
There is a version of this story that sounds like routine AI benchmark news: another model, another leaderboard, another incremental improvement. That reading misses what is actually happening here.
TRIBE v2 is making a structural argument about how neuroscience should be done. For most of its history, the field has worked the way physics worked before Newton: many careful observers, each producing excellent local maps of a complex landscape, with no unified framework connecting them. Foundation models offer a different approach. Train one system on everything simultaneously. Let the structure of the data teach the model how the brain organises itself. Then use the model to generate and test hypotheses faster than any traditional pipeline can.
The AlphaFold parallel the authors draw is specific and instructive. Before AlphaFold, protein structure prediction had resisted decades of isolated efforts. After it, the field moved on. The contribution was not just a better prediction score. It was a new way of working. Hypotheses that would have taken years to test experimentally could be screened computationally in hours. TRIBE v2 is proposing the same shift for neuroscience. A planned experiment can now be run in silico before anyone enters a scanner. Sample size requirements can be estimated more accurately because expected effect sizes are known in advance. Scanner time, which costs hundreds of dollars per hour, can be reserved for the experiments that matter most.
The scaling curve has no plateau. The open weights are on HuggingFace. The code is on GitHub. The interactive demo is live. What gets built on top of this in the next three years is the part worth watching.
Thank you for reading! If you enjoyed this story, please consider giving it a clap, leaving a comment to share your thoughts, and passing it along to friends or colleagues who might benefit. Your support and feedback help me create more valuable content for everyone.
How Meta’s TRIBE v2 Predicts Human Brain Activity Using AI was originally published in Towards AI on Medium, where people are continuing the conversation by highlighting and responding to this story.