The one-page sanity check that now sits inside every Power BI model I own — and the surprise after six months that changed how I think about data engineering.
₹15 lakhs of revenue had been misattributed across customer segments for three months before our finance team caught it. The week after the audit, I gave myself one job: build the framework that should have caught it instead of them. It took five working days. It now sits inside every Power BI model I own, and it has caught two more bugs since — including one that wasn’t even ours.
This is the post about what I built, why it’s smaller than most people assume reconciliation needs to be, and the surprise after six months in production that I genuinely didn’t see coming.
The earlier post about the bug itself covered the embarrassment of shipping wrong numbers for a quarter. This is the practical sequel — the unglamorous, surprisingly small piece of engineering that means I sleep better on Sunday nights now.

The Shape of the Thing
The framework is narrow on purpose: compare a small set of canonical aggregate numbers between the Power BI semantic model and the source ERP every morning, and yell at someone the moment the two stop agreeing. That’s the whole thing. Three components, all running on tools we already had.
Here’s what one entry in the canonical metric set actually looks like in production. The whole framework grows out of this shape:
- metric_name: revenue_by_segment_premium
  description: "Premium segment Q-to-date revenue"
  dax_query: |
    EVALUATE
    SUMMARIZECOLUMNS(
      DimCustomer[CustomerSegment],
      "Revenue",
      [Total Revenue]
    )
    WHERE DimCustomer[CustomerSegment] = "Premium"
  sql_query: |
    SELECT SUM(transaction_amount) AS revenue
    FROM ods.fact_sales fs
    JOIN ods.dim_customer dc
      ON fs.customer_key = dc.customer_key
    WHERE dc.customer_segment = 'Premium'
      AND fs.transaction_date >= '${quarter_start}'
      AND fs.transaction_date < '${as_of_date}'
  tolerance_pct: 0.5
  alert_severity: high
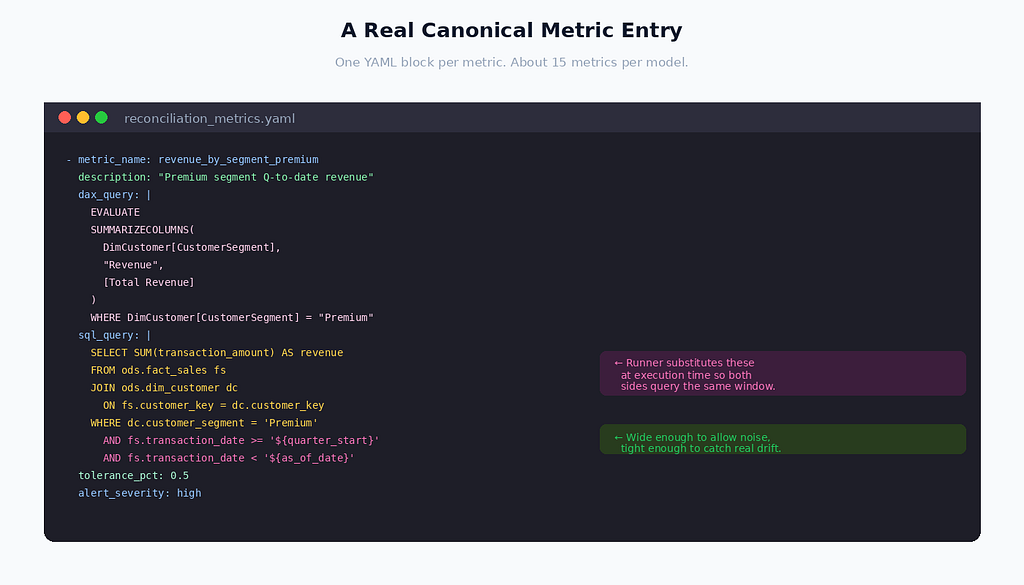
Two things to notice. The ${quarter_start} and ${as_of_date} placeholders get substituted at execution time so we're always comparing the same time window on both sides — without that, you compare yesterday's snapshot to today's snapshot and chase phantom drift forever. Second, the tolerance is 0.5%. Not zero. Floating-point arithmetic and refresh-timing micro-differences mean the two systems will almost never agree exactly. Wide enough to allow noise, tight enough to catch the kind of systematic drift that broke our segment revenue.
The whole canonical set fits on one printed page. About fifteen metrics, grouped by domain — revenue, customer count, churn, pipeline.
The Three Components
The framework has three pieces. Each one is small enough to explain in a paragraph, and the simplicity is intentional — the goal was something I could rebuild from memory if I had to.
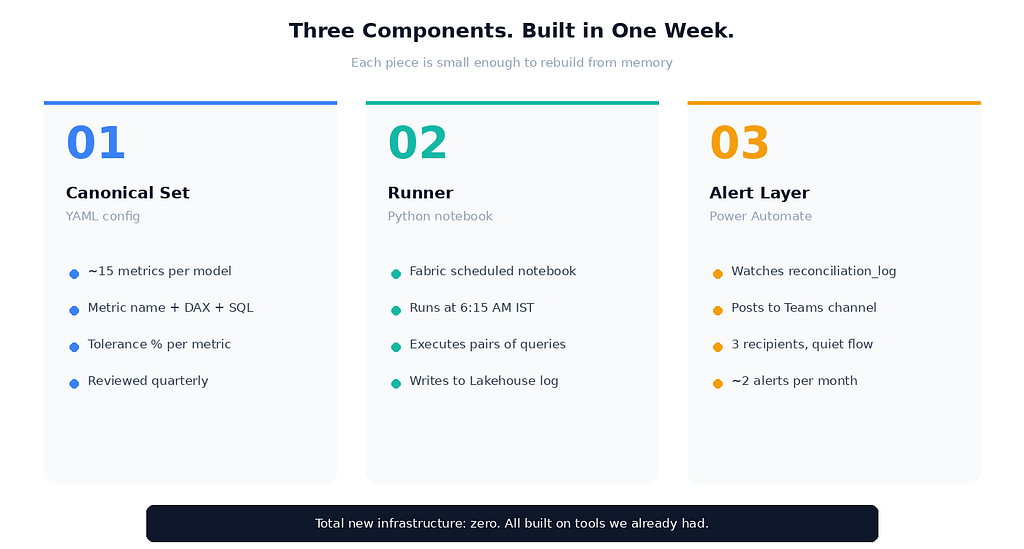
The first component is the canonical metric set. A YAML configuration file with one entry per metric, in the shape you saw above. I keep it small on purpose — about fifteen metrics per model, focused on the numbers that show up on executive dashboards.
I made the temptation mistake on day two. I had a list of forty-three metrics drafted and ready to add. Sharma — our team lead — looked at it for thirty seconds and said: “Which of these would you actually act on if it broke?” Fifteen of them. The other twenty-eight got cut. I keep that original list of forty-three in a separate file as a reminder. Every six months I look at it, decide nothing on it has earned promotion, and close it again. The discipline of keeping the set small is the most important design choice in the whole framework, and it took someone smarter than me asking the obvious question to enforce it.
The second component is the reconciliation runner. A Python notebook in Fabric, scheduled via the Data Factory pipeline that already runs our daily refresh. The notebook reads the YAML config, executes each pair of queries — DAX against the semantic model via the XMLA endpoint, SQL against the ERP via the gateway connection — and writes the results to a Fabric Lakehouse table called reconciliation_log. Each row records the metric name, the Power BI value, the source value, the absolute difference, the percentage drift, the timestamp, and whether the drift exceeded tolerance. The runner takes about four minutes to execute for our fifteen metrics. We run it at 6:15 AM IST, fifteen minutes after the main refresh completes.
The third component is the alert layer. A Power Automate flow that watches the reconciliation_log table for rows where the tolerance was breached, and posts to a dedicated Teams channel called bi-reconciliation. The channel has exactly three people in it — me, Sharma, and Anita from finance. Nobody else. Most days the channel produces nothing. About twice a month, it produces something we care about.
That’s the whole system. Three components. None of them individually difficult. The hard part was the discipline, not the engineering.
The Surprise: It Doesn’t Just Catch Your Bugs
The thing I didn’t expect about reconciliation — the thing that changed how I think about data engineering — is that the framework has now caught two bugs that weren’t ours.
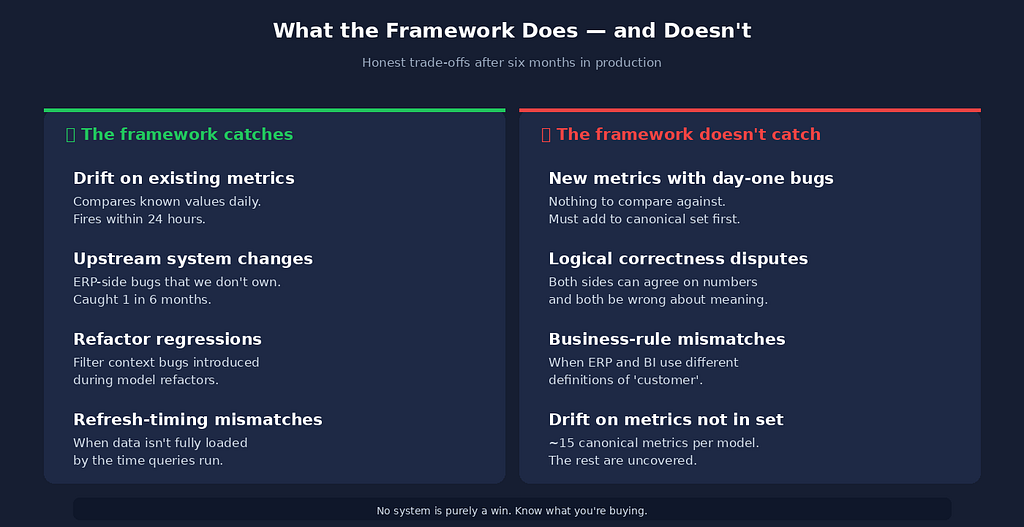
The first was on the ERP side. A deprecated currency code was being miscategorised in a way that affected about 0.7% of transactions. Small enough that no one in finance had spotted it directly. Large enough that our reconciliation tolerance fired the second the daily comparison ran. We pulled the alert, traced the discrepancy to a specific transaction subset, sent the finding to the ERP team. They fixed it within 48 hours. Without the framework, we would have shipped that bug downstream into our segment-level revenue dashboards and noticed it months later, if at all.
The second was a refresh-timing issue. One of our upstream data sources silently shifted its delivery window from 2 AM to 5 AM. Our 6 AM refresh was now picking up partial data — complete enough to look right, incomplete enough to drift. The reconciliation framework caught it the morning the change took effect. The upstream team hadn’t told anyone. They hadn’t planned to.

This is the part I want to emphasise because it changed how I think about building data systems. A semantic model sits at the end of a long chain of systems. Most of those systems are owned by people who don’t share your incentives. Reconciliation gives you a way to detect when something further up the chain has changed without telling you. It doesn’t just protect your dashboards from your own mistakes — it protects them from everyone else’s too.
The operational footnote: false positives. Month one produced nine alerts; six were false. We tuned the schedule (moved it 15 minutes later so the ERP’s nightly batch had reliably completed), added a retry-with-delay pattern for transient mismatches, and walked the false-positive rate down to roughly one per month over the next five months. Tolerable. Not zero, but tolerable — which is the right target for a framework like this. Zero false positives means you’ve set the tolerance too wide, and you’ll miss the next real bug when it lands.
The Trade-Offs I’m Still Negotiating
No system is purely a win. Three things the framework doesn’t do well.
It misses new bugs. A customer-lifetime-value measure shipped with a wrong cohort definition. We caught it three weeks later, by hand, because the metric wasn’t in the canonical set yet. The lesson: new metrics need to be added on ship day, not at the quarterly review.
It costs about 8% of daily CU budget on our F4. Noticeable on small SKUs, rounding error on F64+. If you’re capacity-constrained, run the framework against a subset of metrics first and see what hurts.
The canonical set drifts if you don’t maintain it. Metrics get renamed, segments get reclassified, schemas refactor. We’ve modified the YAML in five of the last six quarters. The framework is a living artefact, not a set-and-forget.
Closing Thought
There’s a principle from my UI/UX days that’s been on my mind throughout this work: trust is built by what the system catches, not by what it prevents.
Reconciliation works the same way. Nobody in our organisation can see the framework. It runs at 6:15 AM, posts to a Teams channel three people read, and most days produces no output at all. But twice in the last six months, it caught a discrepancy before it reached a stakeholder. Once when a refactor introduced a subtle filter context bug. Once when an ERP-side change shifted segment classification. Both times, I walked into the Monday meeting knowing the numbers were right — not hoping, knowing.
The senior version of test the breakdowns, not just the totals is this: build the systems that test them for you, every day, without anyone having to remember. Five working days of build time, ongoing, in exchange for that confidence — multiplied across every Power BI model I’ll own for the rest of my career. It’s the best return on engineering investment I’ve had in years.
I Built a Power BI Reconciliation Framework in One Week — It Caught Two Bugs That Weren’t Even Mine was originally published in Towards AI on Medium, where people are continuing the conversation by highlighting and responding to this story.