The relationship I got wrong in a customer model — and why nobody caught it until a stakeholder asked the wrong question.
A number on our dashboard was wrong for three months.
The finance audit caught it. And finance only caught it because someone asked an awkward question at the wrong meeting.
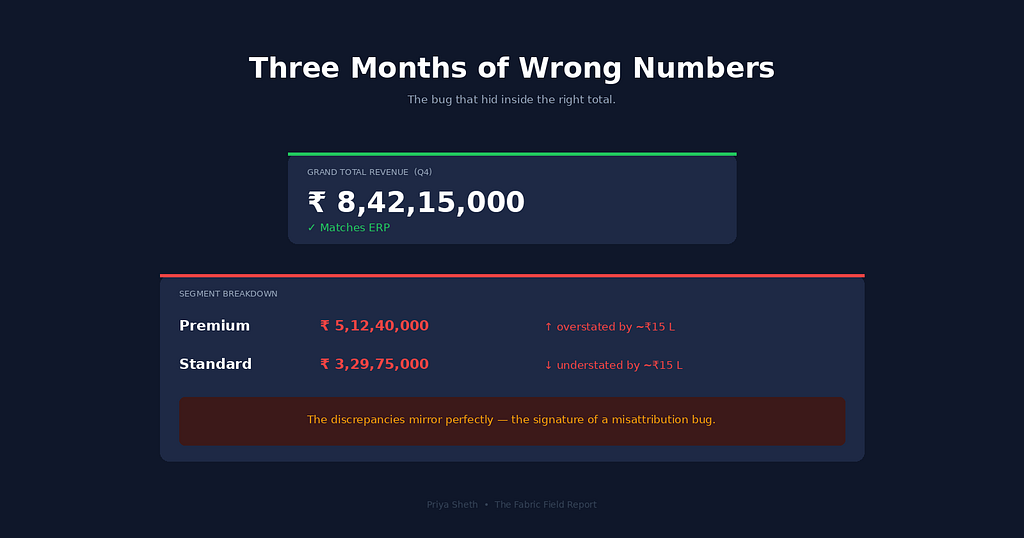
Total revenue was correct. The grand total. The headline figure on the executive summary card was, as far as anyone could tell, accurate to the rupee. It was the breakdown underneath that was off — Premium segment revenue inflated, Standard segment under-reported, by an amount that ended up costing us a quarter of pipeline forecasting and a marketing budget reallocation that, in hindsight, was made on a misshapen number.
I want to walk through this one carefully, because the mistake is one I think most Power BI developers will make at some point in their career, and the bug is invisible enough that you can ship it to production for months without noticing. I shipped it. Nobody on my team noticed. Our stakeholders looked at the dashboard every Monday and didn’t notice. The number looked plausible. That’s the part that still bothers me.
The Setup
It was October. We were building a new customer analytics model — the one that powers our segment-level revenue and lifetime-value views for the sales leadership team. The data was straightforward by Power BI standards. One fact table, FactSales, with transaction-level records — about 12 million rows. Two dimensions: DimCustomer and DimProduct. A calendar table. The kind of star schema you can sketch on a napkin.
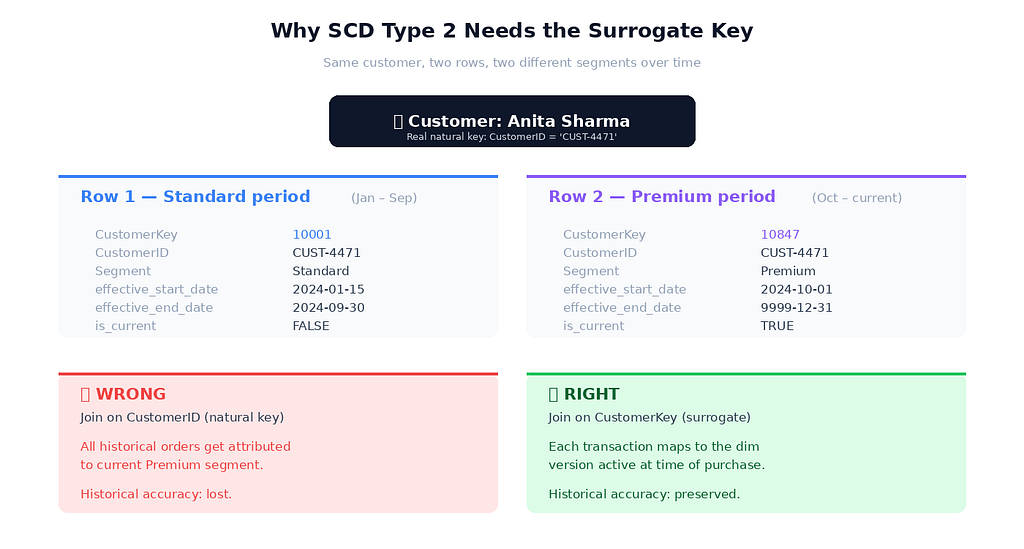
The interesting part was DimCustomer. We track customer segment history with Slowly Changing Dimension Type 2 — when a customer moves from Standard to Premium, we don't overwrite their record. We close out the old row with an effective_end_date and insert a new row with the new segment and a fresh effective_start_date. Every transaction can then be attributed to the segment the customer was in at the time of purchase, not their current segment.
That’s the whole point of SCD Type 2. Historical accuracy. A customer who upgraded to Premium last month shouldn’t suddenly have their orders from January attributed to Premium-segment revenue. Their January orders happened when they were Standard. The numbers should reflect that.
Most Power BI models I’ve seen never bother with this. They overwrite. When a customer changes segment, they just change segment, and history gets retroactively rewritten. We didn’t want that. So our DimCustomer table had two key columns: CustomerID, the stable natural key from the source system (a customer is one CustomerID forever), and CustomerKey, a surrogate key that's unique per version of a customer record.
In Power BI, I built the relationship between FactSales and DimCustomer the way it felt obvious. Both tables had a CustomerID column. Power BI's auto-detect surfaced the relationship immediately. I clicked confirm. The model loaded. The visuals worked. I moved on.
That was the mistake.
What Actually Happened
When you join FactSales to DimCustomer on CustomerID, and your dimension has multiple rows per customer because of SCD Type 2, you get a many-to-one ambiguity that Power BI resolves in ways that are almost correct but not quite. Specifically, for any single transaction, the engine picks one matching DimCustomer row to associate it with — usually the most recent one, depending on how the relationship and filter context resolve. So every historical transaction for a customer who has ever been Premium gets attributed to their Premium segment, regardless of when the transaction actually happened.
The grand total stays correct because every transaction still gets counted once. But the segmentation breakdown shifts. Customers who moved up to Premium during the year carry their entire transaction history with them into the Premium bucket. Premium revenue looks inflated. Standard revenue, mathematically the residual, looks deflated.
The fix is what I should have done from the start: join on CustomerKey, the surrogate key. Each transaction in FactSales should already carry the CustomerKey of the dimension version that was active at the time of purchase — usually populated by the ETL job that loads the fact table, by looking up the appropriate dimension row based on transaction date. Then the join is unambiguous. One fact row maps to exactly one dim row. Historical attribution is preserved.
That CustomerKey lookup at ETL load time is the unglamorous, easy-to-forget step that makes SCD Type 2 work. We had the surrogate key in the dimension. The fact table didn't carry it. The fact table only had CustomerID, the natural key. So even if I'd built the relationship on CustomerKey, the join would have failed for lack of a matching column.
I had set up the dimension correctly. I had skipped the part that connected it.
The Three Months
The dashboard shipped in early November. The first quarterly business review happened in early February. In between, we held twelve weekly executive updates. Six segment-level forecasting meetings. One mid-quarter strategy session where we made a real budget decision based on the trend lines that came out of the model.
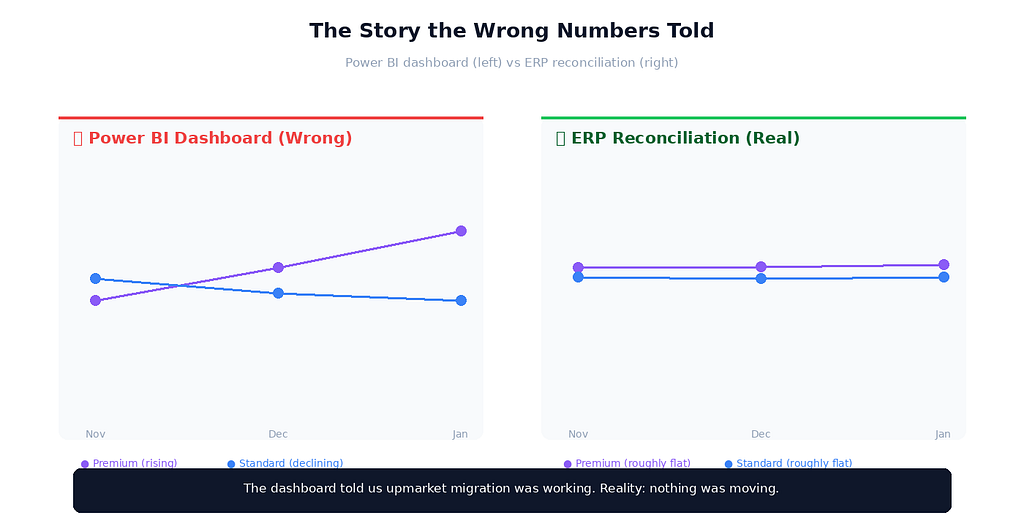
Here’s what the wrong numbers told us. Premium revenue trended steeply upward through Q4 — month over month, it kept growing. Standard revenue trended slightly down. The story everyone wanted to believe was that our upmarket strategy was working: Standard customers were upgrading to Premium, Premium retention was holding, and the revenue mix was shifting in the direction we’d targeted.
Sales leadership ran with it. They increased Premium-tier marketing spend by about thirty percent for the new year. They deprioritised a couple of Standard-tier retention experiments. The Q1 plan, finalised in early December, allocated budget on the assumption that Premium-segment revenue would continue growing.
I want to be honest about how this happened, because the part that haunts me is how invisible the bug was. The total revenue number was correct, and that’s the number everyone checks first. The trend direction was directionally plausible — there really was some upgrade activity, just much less than the dashboard suggested. The Premium-tier numbers weren’t impossibly high; they were just higher than reality. There was no anomaly large enough to trigger a manual review.
If Sharma had asked me in November, “is this Premium revenue real?”, I would have said yes. I had no reason to doubt it. The model loaded clean. The relationships looked correct in the model view. The DAX measures worked. Stakeholders weren’t complaining.
The bug was working perfectly, in the sense that it was producing consistent wrong numbers that nobody had a baseline to compare against.
The Audit Catches It
In early February, our finance team ran their quarterly reconciliation between Power BI dashboards and the source ERP system. This is meant to catch exactly the kind of subtle drift I’d shipped. They pull segment-level revenue from the ERP database directly, and from our Power BI semantic model via the XMLA endpoint, and they compare.
The grand totals matched. The segment breakdowns didn’t. Premium was overstated by about ₹15 lakhs across the quarter. Standard was understated by the same amount. The discrepancy was almost perfectly mirrored — exactly the signature of a misattribution bug, where revenue is going to the wrong bucket but not being lost.
The finance lead — let’s call her Anita — sent me a one-line email at 9:14 AM on a Tuesday: “Quick one, do you have ten minutes? Something doesn’t reconcile and I want to walk through how Power BI is computing segment revenue.”
I knew it was bad as soon as I read it. Finance teams don’t pull you into “quick” calls about reconciliations that work. I opened the Power BI model in advance, expecting I’d be defending the numbers, and within about three minutes of looking at the relationship between FactSales and DimCustomer, I felt the floor drop. The join was on CustomerID. Of course it was. That was the obvious choice. And as soon as I saw the pair of arrows pointing at the natural key, my brain finished the sentence — this only works if customers never change segment.
Anita was generous about it. The conversation was professional. She let me explain what had happened, asked me to write up the impact in numbers, and brought it to her director before she escalated. I think she could tell from my voice that I already knew exactly what was wrong, and that the pain of fixing it would be its own correction.
I spent the rest of that day re-keying. The fix had three parts. First, update the ETL job that loads FactSales so it looks up the active CustomerKey for each transaction based on transaction date and customer ID — every fact row now carries the correct version of the customer at the time of purchase. Second, rebuild the relationship in Power BI to join on CustomerKey. Third, reprocess three months of historical fact data, because the existing rows didn't have surrogate keys populated.
The reprocessing job took about six hours. The corrected numbers came in. Premium revenue dropped meaningfully — closer to the trend that finance had been quietly seeing in the ERP all along. Standard revenue came up. The story changed.
What I Tell Other Analysts Now
The first thing I say is that SCD Type 2 + natural key joins is a category of mistake, not a one-off bug. Power BI’s auto-detect will surface the natural-key relationship every time, because natural keys are usually named the same in both tables. The relationship looks right. The model loads. The visuals work. The bug only shows up when customers actually move between versions of the dimension — which is to say, exactly when SCD Type 2 is doing the work you built it for.
The second thing is that the fact-table side is where SCD Type 2 actually lives, not the dimension side. Most tutorials show you how to build a Type 2 dimension. Very few walk you through the ETL step where the fact table picks up the right surrogate key on load. That step is the connective tissue. Without it, your beautifully versioned dimension does nothing.
The third thing — and this is the one I wish someone had told me three years ago — is that the most dangerous Power BI bugs are the ones where the total is right. If your grand total is wrong, someone notices within a week. If your segmentation is wrong but the total still matches, you can ship the bug to production for a quarter. Spot-check the breakdowns, not just the totals. Run a reconciliation against source-system data at the segment level whenever you ship anything that uses SCD Type 2.
The Senior Version of This Mistake
I want to talk about the senior version of this mistake, because I don’t want anyone reading this to think it only happens to analysts in their first or second year.
The senior version isn’t joining on the wrong key. The senior version is building the right relationship on the right key — and then forgetting to populate the surrogate key in the fact table at ETL time. The dimension is correct. The Power BI model is correct. The DAX is correct. The pipeline is wrong. And because the pipeline lives outside Power BI Desktop, it’s not visible in the model view. The relationship looks pristine.
I’ve watched experienced architects build sophisticated SCD Type 2 dimensions with full version history, hash-based change detection, and effective date ranges — and then load the fact table with only the natural key. The dimension does nothing. All that careful version history sits in a table that the rest of the model doesn’t know how to talk to.
The mistake gets harder to catch as you get more senior, because the failure mode moves from “wrong relationship” (visible in Power BI) to “wrong load logic” (invisible in Power BI). When a junior person makes the mistake, the model view shows it. When a senior person makes the mistake, the model view shows nothing wrong — the bug is upstream.
Test the breakdowns, not just the totals. That’s the lesson.
A UI/UX Reflection on This
There’s a principle from my UI/UX days that maps onto this whole story: invisible errors are the worst errors. In interface design, a form field that’s broken in an obvious way — a button that doesn’t work, a layout that’s clearly mis-rendered — gets fixed within hours. The bugs that linger are the ones where the form appears to work, submits the data, returns a success message, and silently sends the user’s information to the wrong place. Visible bugs get fixed. Invisible bugs ship.
Data modelling has the same shape. The DAX that throws an error gets fixed before the model is published. The relationship that loads cleanly but produces silently wrong numbers can sit in production for months. The grand total looks right. The dashboard renders. Stakeholders smile in the Monday meeting. Nobody knows.
The instinct I’m trying to build now — and I’m still working on it — is to actively look for the kind of wrong that doesn’t announce itself. Reconcile segment totals against source systems, not just grand totals. Build a sanity-check page in every model that aggregates differently than the main views and compares — if both paths to the same number agree, the relationships are probably correct. Treat every new dimension relationship as a hypothesis that needs validation, not as a finished decision.
That’s not the kind of work that ships features faster. It’s the kind of work that prevents three months of decisions being made on a misshapen number.
I think about Anita’s email sometimes, and the very specific shame of realising she’d been seeing the discrepancy for weeks in her ERP reports before she felt sure enough to bring it up. We have a reconciliation process now. We didn’t, then. The cost of building it would have been about a week of engineering time. The cost of not building it was three months of strategic decisions in the wrong direction. The arithmetic isn’t subtle, and yet I had to ship the bug to learn the arithmetic.
The Power BI Mistake That Quietly Skewed Our Numbers for Three Months was originally published in Towards AI on Medium, where people are continuing the conversation by highlighting and responding to this story.