Accuracy doesn’t lie — but it doesn’t tell the whole truth either.

1. Introduction
In the world of AI, building Machine Learning (ML) models has become surprisingly easy, sprinkle in a bit of creativity, test a few architectures, and chances are you’ll get some fascinating results. The size and the architecture of these models often depend on how complex the underlying data distribution is. But in this excitement, we often tend to overlook something fundamental: The role of model evaluation metrics.
These metrics are not just some numbers. They are beautifully crafted mathematical functions, designed to gauge how well our model behaves. Think of them as tiny wormhole, unending tunnels formed through equations that help us to answer some critical questions:
- Is the model overconfident?
- Does the model hesitate? or
- Does the choice of dataset have any impact on the results?
Accuracy perhaps is the most familiar metrics due to its simplicity and interpretability. In the binary classification scenario, this trust is well-deserved. But when we step into multiclass and real-world imbalanced datasets, the reliability quietly breaks down. In this article we explore why accuracy sometimes defies its own foundational intuitions. By examining different averaging strategies, confusion‑matrix geometry, and empirical simulations, we show that the issue is not with the metric itself, but with the question we are unknowingly asking our metrics to answer.
1.1 The Basics
To truly understand our model, like the places it shines, places where it falls, we must revisit the “grid world” of confusion matrix. This is where every decision of our model leaves its footprint. Let’s take the example of Binary classification:
Let’s say our model is ought to classify
- Cat ~ (1, I’m a cat person),
- Dog ~ (0).
The case where our model correctly identifies the cat images, we call it True Positives (TP), similarly True Negatives (TN) if it correctly identifies dog images. Now if model mistakenly calls dogs as cats and the other way round, we call this False Positive (FP) and False Negatives (FN) respectively.
To capture this, we need two specialized metrics i.e., Specificity to capture FP and Sensitivity (aka Recall) to capturing FN. For general evaluation (if we have equal representation of cats and dogs), we can check the correct predictions with respect to all predictions and declare how accurate the model is {Accuracy= TP+TN/ (TP+TN+FP+FN)}. Now, according to fundamental mathematics, accuracy must lie between Specificity and Sensitivity (here the mathematical proof [Link]).
1.2 The Enigma
But the foundations of this elegant relationship fail in case of multiclass classification with imbalanced datasets (representation of Cats ≠ Dogs). Empirical experiments show that the most loved metric accuracy would sometimes exceed the bounds. In simple terms, let’s say Sensitivity (catching actual cats) is 95% and Specificity (correct dog detection) is 90%, and somehow accuracy: 10%. This is basically mathematically impossible, but if it were true, it would mean the model is brilliant at identifying cats and great for dogs, but somehow, when you mix them together, it suddenly forgets what animals are and starts calling everything a duck!

2. The Core Hypothesis: The Architectural Conflict of Averaging
Let’s imagine sharing a pizza among several friends, each with a different appetite. Suppose
- One friend eats a lot
- One eats very little
- Others are somewhere in between
Now you have three options:
- First, you give each friend equal number of slices regardless of size of the slices and their appetite. We call this method Macro averaging, wherein you treat all classes equally.
- Second, you throw all slices on a plate and divide proportionally based on hunger. We call this method Micro averaging, wherein you treat each example/instance equally (friend who eat the most get the most!)
- Lastly, you give each friend slice based on their appetite but still treat each friend separately. We call this method Weighted averaging, wherein you weight classes by size.
That traditional bounding proof in binary classification assumes that accuracy is calculated as a convex combination (class -prevalence-weighted average) between Sensitivity and Specificity. However, in multi‑class classification (cats, dogs, leopards, vampires etc.), the usual Accuracy does not treat classes equally. It simply counts how many predictions were correct out of all predictions. Because of that, accuracy is mathematically the same as Micro‑averaging, as it weights classes implicitly by their frequency rather than enforcing per‑class fairness. Now this is a fundamental architectural conflict!
This conflict is severely scaled in class imbalance scenarios, where the high influence of majority class inflates the instance-weighted accuracy, allowing it to surpass the limits set by the macro metrics.
If your data is imbalanced, your accuracy is too!
3. Navigating Multiclass Evaluation: The Metric Choice
Life was simple in the binary world, just one confusion matrix, two outcomes and everything is all well in place. But scale this to K different classes, that single looking matrix explodes to K×K confusion jungle. Typically, to make life simpler we often break this big matrix in K 2×2 matrices. This allows us to have one matrix for each class using One-vs-rest trick (cat vs dogs, leopards, vampires etc. combined). Now based on what strategy is used to combine these K classes (equal weightage to every class or every sample) sparks the weighted vs unweighted conflict!!!
3.1 The Great Conflict: Classes vs Samples
Let’s direct the climax of this movie with some characters and approach the anomaly. Starting by taking a K×K confusion matrix and Cᵢⱼ a count of number of instances (total N) of class i being predicted as j. Now, Micro metrics enters the room and declares “LET THE MAJORITY RULE!”. This behavior can be understood as they are instance weighted, that is if a class is heavily represented, it basically dictates the final score. Then enter Macro metrics and say, “EQUAL RIGHTS FOR ALL CLASSES!”. It essentially means each class equal rights even it has poor representation. Music stops! The poor choice of metric will make the poor “accuracy” behave totally different from what it should be (Accuracy>Macro Specificity/Macro Sensitivity).
The moot point here is Accuracy (Micro accuracy) is being pulled by the majority class, but macro specificity is held back by weighting every class equally. To put simply, the model behaves well overall but one giant class dominate and majority drowns. Mathematically this (Specificity) could be expressed as
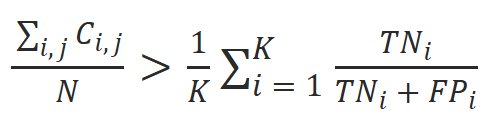
The numerator here is powered by volume and denominator is dragged by class fairness. (same could be extended to Sensitivity).
3.2 Empirical Validation
To show the architectural conflict analytically, we conduct a controlled simulation experiment using (500) randomly generated multiclass confusion matrix in the below figures. This experiment is designed to isolate the effect of class balance and averaging strategy on metrics, independent of any specific model or dataset.

Figure 1 — Imbalanced 3‑Class System (Amplification of the Violation Under Class Imbalance)
In the case of class imbalance case, macro sensitivity becomes highly unstable, essentially pulled downward by minority class detection, while macro specificity remains high due to dominant majority class performance. As the micro accuracy is being dominated by majority class, weighing individual samples than classes as equal entities hence we see high violation rate (~49.6%). Hence, in this structure accuracy is getting sample specific instead of class.
These empirical observations confirm the core hypothesis of this article: the paradoxical behavior of accuracy arises from an architectural mismatch between micro‑level instance weighting and macro‑level class aggregation.
Accuracy has not become mathematically incorrect; it has simply become misaligned with the question we expect it to answer. The apparent violation is not a bug in evaluation, but a consequence of averaging strategies pulling metrics in fundamentally different directions.
When classes are imbalanced, accuracy becomes a biased narrator.

4. Who Wins?
So how wins the war? Should we use Macros or Micro for averaging? Simple answer — Depends. The one that is absolute here is that Micro and Macro metrics tell entirely different stories. As long as there’s an influence of a class over final scores, the sanctity of the equation will be violated. But thing to remember is that this isn’t a bug, that choice is supreme, if not then fairness and frequency may pull the math in opposite directions.
Now that case is almost closed. But we need to file a report on which metric to trust and when? Simple answers, if you wish to check overall model performance, given the class proportions. One must always use Micro metrics. On contrary, if you wish to calculate metrics considering all classes equal. Then one must choose Macro metrics. And lastly, if you wish to respect all class sizes and average sensibly. Then choose Weighted average, a comprise between Micro’s realism and Macro’s fairness.
As a leaving note, multi-class evaluation can be messy, especially when classes influence scales of measurement. Micro tells you how model behaves when untamed, Macro hints at its best behavior (fairness). Use both and report them together, more importantly read them for what they mean and the mystery resolves itself! The model wasn’t lying after all; we are just asking different questions.
When Accuracy Lies: Rethinking Metrics in Imbalanced Multiclass Models was originally published in Towards AI on Medium, where people are continuing the conversation by highlighting and responding to this story.