DAX User-Defined Functions in Power BI (Preview): How One Function Replaced 40 Format Strings in My Model
The night a finance email almost broke my weekend — and the September 2025 preview feature that made sure it never happens again.
I want to start with the email that ruined a Tuesday evening.
It was 4:47 PM. I’d just made tea and was opening my laptop for the last hour of the day when the message arrived from our finance lead: “Quick one — going forward, please display all currency values to two decimals instead of zero. Effective tomorrow’s exec review.”
Sixteen hours’ notice to update forty-three DAX measures across our flagship semantic model.
I closed the laptop. I opened it again. The cat sat on my keyboard. I moved the cat. I started clicking.
Three hours later, at 7:51 PM, dinner long forgotten, I’d updated forty-one of them. The other two showed up on Wednesday morning when our regional manager pinged me on Teams: “Why does Total Revenue show two decimals but Net Revenue still shows zero?”
I apologised. I fixed it. I closed the ticket. And then I sat with the discomfort of knowing this was the fourth time in three years I’d done some version of the same thing — manually editing dozens of nearly-identical measures because finance changed a display rule. Each time it ate an evening. Each time I missed at least one. Each time I told myself “next time I’ll build something better.” I never did.
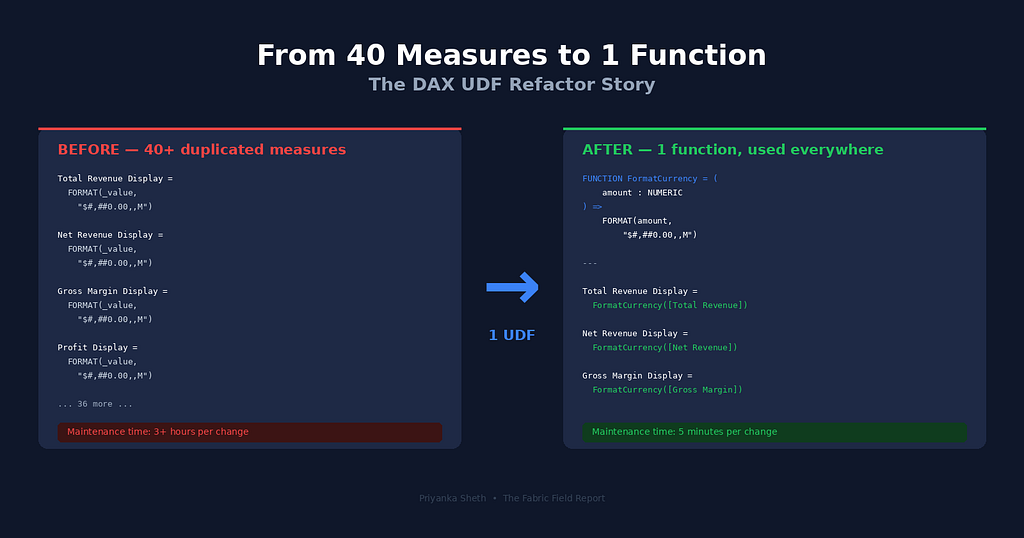
What I didn’t know that Wednesday morning was that Microsoft had quietly introduced a preview feature that pointed to a real fix. Once I found it, my entire formatting layer collapsed from forty-three duplicated measures into a single function I could update in five minutes.
This post is about using DAX User-Defined Functions (UDFs) in Power BI Desktop to eliminate duplicated logic across measures — what works, what to watch for, and how I refactored a real production model in one Sunday afternoon.
The Problem Every Power BI Developer Has, But Nobody Talks About
If you’ve spent any real time in Power BI, you’ve written this pattern. Probably hundreds of times. Probably across multiple models.
Total Revenue Display =
VAR _value = [Total Revenue]
RETURN
FORMAT(
    _value,
    IF(ABS(_value) >= 1000000, "$#,##0.00,,\"M\"",
    IF(ABS(_value) >= 1000, "$#,##0.00,\"K\"",
    "$#,##0.00"))
)
Eight lines. Smart formatting that abbreviates millions to “M” and thousands to “K.” Beautiful when it appears in a card visual.
Now imagine that same eight-line block sitting inside forty-two more measures. Net Revenue Display. Gross Margin Display. Profit Display. EBITDA Display. The format logic is identical. Only the underlying measure reference changes.
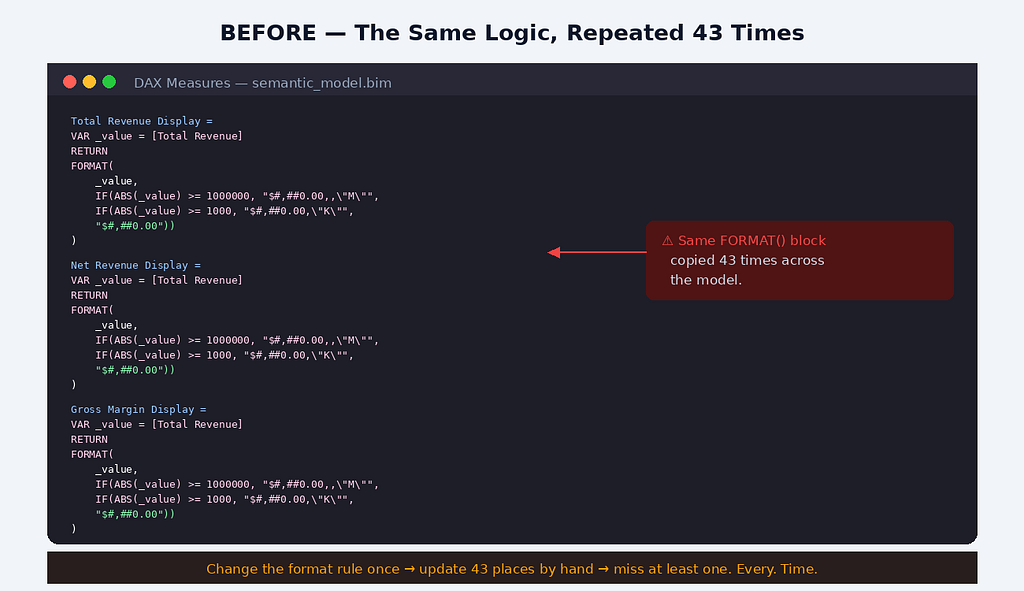
This is the kind of code that feels fine when you’re writing it. You’re moving fast. You copy-paste the formatting block, swap the measure name, move on. The model works. The dashboard looks great. Stakeholders are happy.
Then six months later, finance changes a rule. Or your CFO wants Indian Rupees displayed with the lakh-crore separator instead of millions. Or compliance asks you to show four decimals on regulatory measures. And suddenly you’re staring at a search-and-replace job across forty-three places, praying you don’t miss one.
I think every Power BI developer eventually hits this wall. It’s not a bug in our process; it’s a limitation of the tool. For years, DAX simply didn’t have a way to write reusable parameterised logic. Calculation Groups helped with time intelligence. Variables helped within a single measure. But for cross-measure logic that needed parameters? You copy-pasted. That was the deal.
The deal changed in September 2025.
What Microsoft Quietly Shipped
The September 2025 Power BI release introduced DAX User-Defined Functions as a preview feature — actual, parameterised, reusable functions that live as first-class objects in your semantic model. Not Calculation Groups. Not measure tables. Functions, with type hints and proper parameters, the way every other programming language has had since forever.
Two important caveats up front: as of early 2026, UDFs are still in preview, not generally available. You enable them via Power BI Desktop’s preview-features toggle, and Microsoft’s own documentation continues to flag them as preview. The syntax I’ll show below works in DAX Query View and TMDL view in current preview builds — it may shift slightly before GA, and behaviour can vary across tools like Tabular Editor.
The DAX community had been asking for this for years. SQLBI wrote a deep dive the same week it shipped. Tabular Editor added support quickly. There’s also a community-driven open-source library at daxlib.org — not an official Microsoft ecosystem like npm or PyPI, but a useful place to see how others are structuring reusable DAX, with the usual caveats about validating any community code before importing it into a production model.
The syntax (in current preview builds) looks like this:
DEFINE
/// FormatCurrency: smart-formats a numeric value as currency
/// with K/M abbreviations based on magnitude
FUNCTION FormatCurrency = (
    amount : NUMERIC
) =>
    FORMAT(
        amount,
        IF(ABS(amount) >= 1000000, "$#,##0.00,,\"M\"",
        IF(ABS(amount) >= 1000, "$#,##0.00,\"K\"",
        "$#,##0.00"))
    )
That’s it. The FUNCTION keyword is new. The => (informally called the "rocket" in DAX circles) separates the parameter list from the function body. The triple-slash /// adds a description that shows up in IntelliSense — your future self will thank you for it when she's auditing the model six months from now.
Once defined, you call it like any other DAX function. From a measure. From a calculated column. From a visual calculation. From inside another UDF, if you want to compose them.
The moment I read the documentation, I knew what I was doing that weekend.
The Refactor: One Sunday Afternoon, Forty-Three Measures
I want to be honest about how this went, because the polished tutorials don’t tell you about the moments where you almost give up. I made a backup of the model. I opened a fresh branch in our Git-connected workspace. I poured a coffee. And I started.
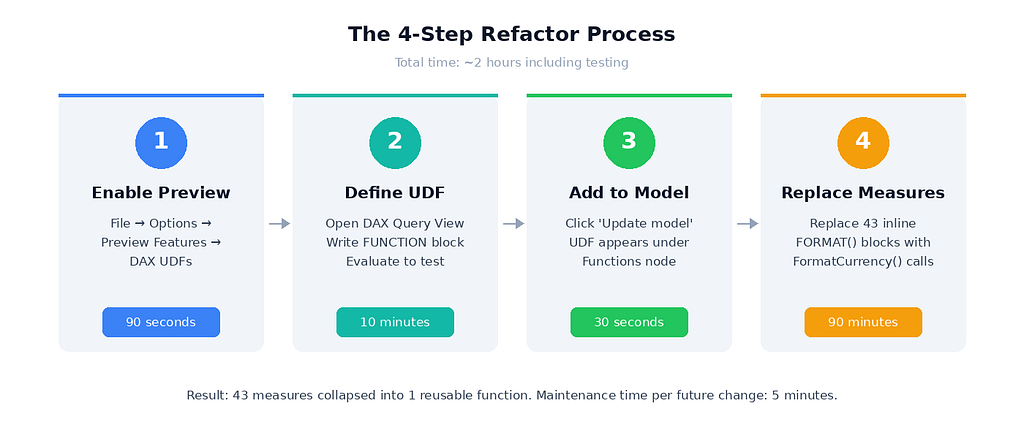
The whole process broke down into four steps, and there were small surprises in every one of them.
Step one: enable the preview feature. UDFs are still preview as of early 2026, hidden behind a toggle: File → Options and Settings → Options → Preview Features → tick “DAX user-defined functions” → restart Desktop. Ninety seconds. The smallest part of the work.
Step two: write the function in DAX Query View — a part of Power BI Desktop most analysts I know never open. If you’re one of them, this is your sign to start. You write the function inside a DEFINE block, add an EVALUATE line to test it, and run it. The first time I ran my FormatCurrency function with a test value of 1,234,567, it returned "$1.23M". Exactly right. I sat there for a second, slightly stunned that something this clean had finally become possible.
Step three: add the function to the model. Click “Update model: Add new function” — a small notice that appears above your code. The function moves from query-scope to a permanent model object, visible in Model Explorer under a new Functions node alongside your tables and measures.
Step four: replace the measures. This was the satisfying part.
Each one of my forty-three display measures collapsed from this:
Total Revenue Display =
VAR _value = [Total Revenue]
RETURN
FORMAT(_value, IF(ABS(_value) >= 1000000, "$#,##0.00,,\"M\"",
    IF(ABS(_value) >= 1000, "$#,##0.00,\"K\"", "$#,##0.00")))
Into this:
Total Revenue Display = FormatCurrency([Total Revenue])
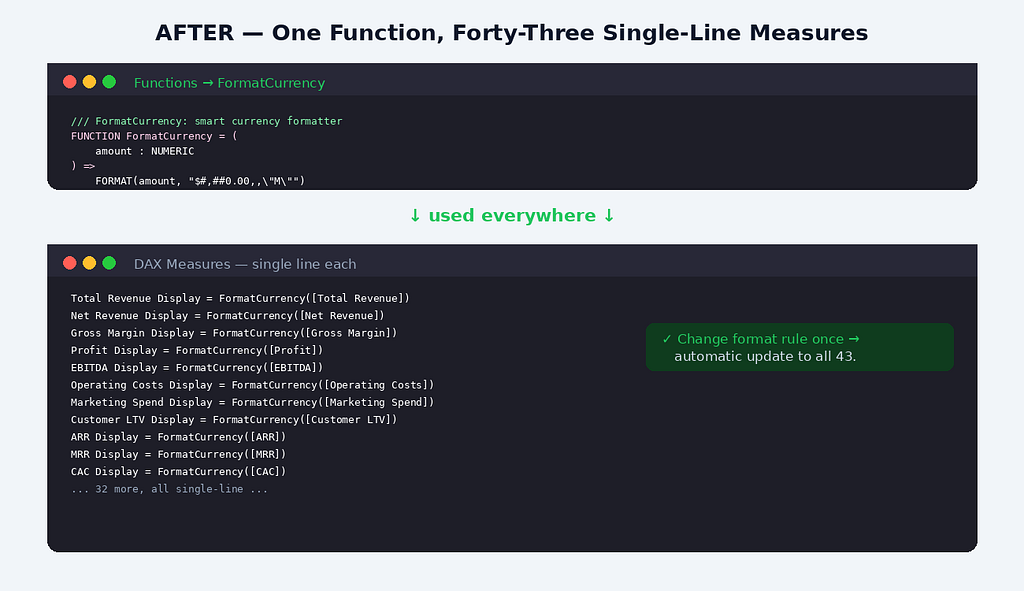
Forty-three measures, refactored in roughly ninety minutes. Most of that time was double-checking that the visual output matched the original — running the report side-by-side with the previous version, verifying that “$1,234,567.89” still rendered as “$1.23M” everywhere it should.
Total time, end to end: about two hours including testing. The next time finance changes a format rule, the work will take five minutes. Update the function. Done.
The Catch They Don’t Put in the Marketing
I’d be doing you a disservice if I made this sound frictionless. There’s one thing that almost made me roll the entire refactor back, and it happened on the very first measure I tried to convert.
I had a measure that wasn’t a simple reference — it was a calculation involving filter context, something like SUMX(Sales, Sales[Quantity] * Sales[Price]). When I passed that expression directly into my UDF, the result came back off by roughly twelve percent. Not catastrophically wrong. Just enough to look plausible and be incorrect.
I spent forty minutes assuming I’d written the UDF wrong before I found the actual cause: when you pass a measure reference into a UDF, DAX wraps it in an implicit CALCULATE for context transition. When you pass a raw expression, that wrapper doesn't happen. Your function silently evaluates with the wrong filter context.
The fix is simple once you know it — declare the parameter with EXPR mode (lazy evaluation) instead of the default VAL mode, or wrap your expression in CALCULATE explicitly. But the gotcha bites quietly. Test every conversion against the original. Don't trust visual output alone — check numerical equivalence on a few specific filter contexts.
There’s also a smaller catch worth knowing: UDFs inside visual calculations only see fields already on the visual. You can’t reference model objects outside the visual canvas. It makes sense once you think about it, but it caught me when I tried to centralise some visual-level math.
One thing that’s easy to miss with FormatCurrency specifically: FORMAT() returns text, not a number. The output of my function is a string like "$1.23M", which means any measure built on top of FormatCurrency([Total Revenue]) is also text. That's fine for card visuals and tooltips, but it breaks numeric aggregation, sorting, and conditional formatting. I keep my "display" measures (Total Revenue Display) clearly separated from my "value" measures (Total Revenue) for exactly this reason — the value measure stays numeric, and the display measure is only used for visual presentation. If you're not careful about that split, you'll end up wondering why a column won't sort by descending order.
There’s also a quieter performance concern worth flagging: FORMAT() is a string operation, and string operations are slower than numeric ones in DAX. For card visuals and KPI tiles where the function runs once or twice, the cost is invisible. For large table visuals, matrix visuals with thousands of rows, or anywhere a formatted measure is being recalculated at high frequency, that overhead can become noticeable. Use formatted display measures where they help readability, not as a default wrapper around every numeric measure.
And it’s still a preview feature, which I want to be honest about. I’m using it in production with eyes open — meaning I have a rollback plan, my measures are version-controlled, and I’m prepared for the syntax to shift before GA. That’s a calculated risk, not a recommendation. If you work in a heavily regulated environment, your governance team may want to wait until GA. Fair. For my models, the maintenance benefit outweighs the preview risk. Your call to make based on your own context.
What Else I’m Building With UDFs Now
Once I had the muscle memory for one UDF, I saw opportunities everywhere. Six weeks in, my model has six functions doing real work.
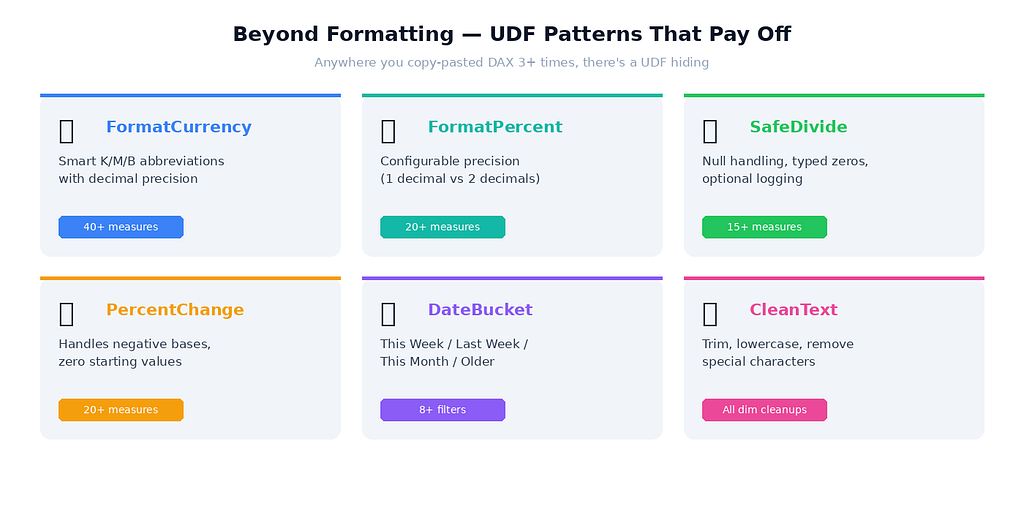
SafeDivide replaced fifteen DIVIDE(numerator, denominator, 0) instances with a function that adds null handling and writes a log entry to a tracking column whenever a division-by-zero happens. Useful when you want to know not just that divisions are blowing up, but how often.
PercentChange handles (new - old) / old logic with proper handling for negative bases and zero starting values — edge cases I'd been writing inline in twenty different measures.
FormatPercent is the same shape as FormatCurrency but with a precision parameter, so I can pass 1 for rate displays and 2 for confidence-interval displays from one function.
DateBucket categorises a date into "This Week," "Last Week," "This Month," "Older" — a switch statement I'd repeated in four different filter contexts.
The pattern that emerged: anywhere I’d copy-pasted DAX more than three times, there was a UDF hiding in plain sight. Look for the repetition. That’s where the maintenance pain lives.
When You Shouldn’t Use a UDF
I want to push back against the “UDFs everywhere” enthusiasm, because the new-toy excitement makes it easy to over-apply them.
Don’t use UDFs for time intelligence. Calculation Groups are still the correct choice for YoY, YTD, MoM, and rolling-window calculations. They solve a fundamentally different problem — applying transformations to existing measures via slicer selection. A UDF can’t replace that.
Don’t use UDFs for one-off logic. If a piece of DAX lives in a single measure and is unlikely to be reused, leave it inline. The indirection of a function only helps when the logic is reused.
And don’t use UDFs as a way to hide context-transition behaviour you don’t fully understand. I’ve seen this pattern — wrapping confusing DAX in a function and hoping the wrapper makes it clearer. It doesn’t. It defers the moment when the confusion becomes a production bug. Learn the underlying mechanics first; reach for the abstraction second.
The Maintenance Math
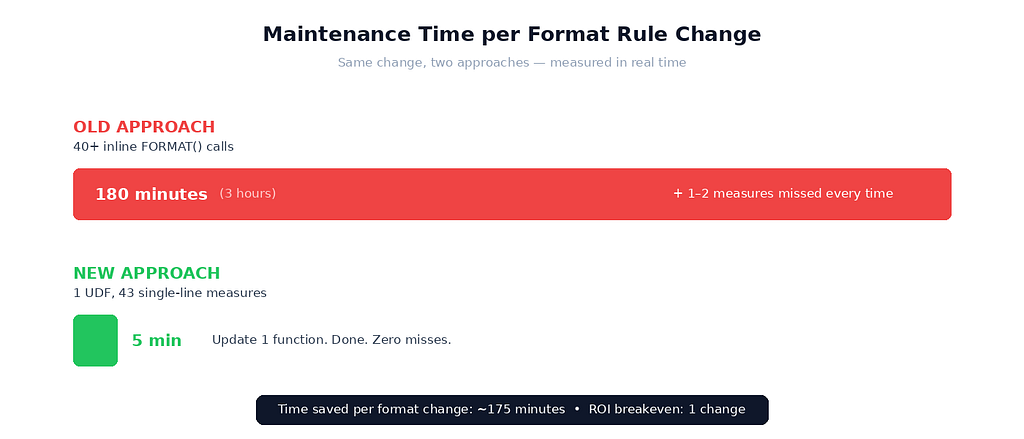
Old approach: forty-plus inline FORMAT() calls, three hours of manual editing per format-rule change, at least one missed measure every time, and onboarding meant explaining "here are forty nearly-identical measures, good luck."
New approach: one UDF. Format-rule changes take five minutes. Onboarding takes one sentence: “the formatting function is FormatCurrency, and it's used everywhere." Cross-model reuse is a TMDL export-import.
The cross-model point is the sleeper benefit. With daxlib.org hosting community UDF libraries, I can pull in a battle-tested SafeDivide written by someone smarter than me and just use it. That's a real shift in how Power BI development scales — a community library, finally, for the calculation layer.
A UI/UX Reflection on Why This Matters
I want to close on something that’s been sitting with me since I shipped the refactor.
In design, there’s a principle I learned early in my UI/UX days: don’t repeat yourself in the interface. If a button appears in three places, those three buttons should be one component, defined once and rendered three times. The reason isn’t aesthetics — it’s maintenance. The day someone changes the button’s colour, you want to update one component, not hunt down three copies.
DAX UDFs bring that same principle to the calculation layer. For years, the data-modelling world has been okay with copy-paste duplication in a way the UI world has not been okay with for a decade. Calculation Groups partially closed that gap for time intelligence. UDFs close it everywhere else.
The finance lead who sent that 4:47 PM email back in February still sends format-change requests every quarter. The difference is what happens after I read them. There’s no more dread. There’s no more clicking through forty-three measures with the cat on my keyboard. There’s a single function I update, a single dashboard I refresh, and a reply I send before my tea goes cold.
That’s the kind of change I think a lot of us underestimate. A feature that saves hours of work is one thing. A feature that quietly removes a recurring dread from your job is something else entirely.
DAX User-Defined Functions in Power BI (Preview): How One Function Replaced 40 Format Strings in My… was originally published in Towards AI on Medium, where people are continuing the conversation by highlighting and responding to this story.