I Trusted Fabric Copilot and Fabric IQ With My Production Pipeline for 30 Days — Here’s the Honest Scorecard
TL;DR
- I ran Fabric Copilot and Fabric IQ alongside my production data pipeline for 30 days to test whether AI-assisted analytics is ready for real workloads — not a sandbox, a real pipeline serving 6 managers weekly.
- Days 1–7 were genuinely impressive. Copilot nailed an SCD Type 2 merge refactor in 38 lines, Fabric IQ caught 847 orphaned keys I’d missed for two months, and I started trusting it.
- Days 8–20 broke the trust. Copilot hallucinated a column name, ignored my Calculation Groups, generated DAX that conflicted with RLS filtering, and the self-healing engine silently dropped 12,247 legitimate rows by injecting a “defensive optimization” nobody asked for.
- By Day 30, I landed on a framework: Copilot owns boilerplate code generation. Fabric IQ owns monitoring. Self-healing handles metadata only. I own all business logic and debugging. That split saves ~3 hrs/week at ~$50/month in CU overhead.
- Full scorecard table, cost analysis, and production-readiness verdict below.

I let AI touch my production data pipeline. On Day 14, it silently dropped 12,247 rows — and didn’t throw a single error.
The pipeline ran green. The dashboard updated. The numbers looked slightly lower, but within plausible range. If I hadn’t been keeping a daily log, nobody would have noticed.
That’s the version that scares me. But let me start from the beginning.
It was 11:14 PM on a Wednesday when I decided to mass-delegate my pipeline to AI. Not because I had some grand research plan. Because I was tired. Specifically, I was tired of debugging the same Spark notebook cell for the third time that week, staring at a shuffled join that was skewing across executors in ways that made zero sense at midnight.
Three years of wrangling data through Excel, SQL, Python, Power BI, and now Microsoft Fabric had taught me one thing with absolute clarity: the most dangerous bugs are the ones that don’t look like bugs. They look like correct outputs. They sit in dashboards for months. They quietly shape decisions no one realizes were wrong.
So when Microsoft expanded Copilot access to all paid F-SKUs and launched Fabric IQ as a platform-level AI assistant earlier this year, I didn’t just want to test it. I wanted to stress it. Put it on a real pipeline, with real data quality issues, serving real stakeholders who would notice if something broke.
Here’s what happened over 30 days. No sugarcoating. No Microsoft PR spin.
Related: If you haven’t read it, this experiment started as a sequel to my earlier piece — I Replaced My Entire ETL Pipeline with Microsoft Fabric — Here’s What Happened. That post covered why I left SSIS. This one covers whether I can now leave myself out of the loop.
The Setup: What I Actually Tested
Let me be specific, because vague “I tried Copilot” posts are useless.
My pipeline:
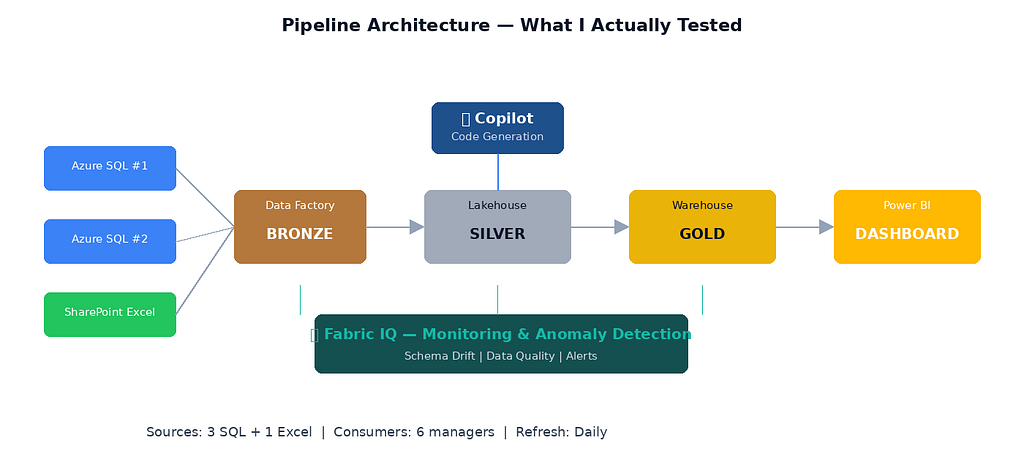
- Source: Three SQL databases (two Azure SQL, one on-prem via gateway) + one SharePoint Excel file (yes, the stakeholders love their Excel)
- Ingestion layer: Fabric Data Factory pipelines pulling into a Lakehouse (bronze zone)
- Transformation: Two PySpark notebooks handling cleaning, deduplication, SCD Type 2 logic on a customer dimension, and business rule application
- Serving layer: A Fabric Warehouse (gold zone) consumed by a Power BI semantic model with ~40 measures
- Consumers: A weekly business review (WBR) dashboard used by 6 managers, plus ad-hoc analysis requests
What I enabled:
- Copilot in Fabric Notebooks — for code generation, debugging, and cell documentation
- Copilot for Power BI — for DAX generation and report building
- Fabric IQ — for data exploration, anomaly detection, and pipeline monitoring
- Self-healing pipeline features — AI-powered auto-remediation for pipeline failures (recently moved toward general availability in 2026, though still evolving in reliability)
A quick clarifier on Fabric IQ vs. Copilot — because I’ve seen confusion in comments on other posts. They’re related but distinct. Copilot is the per-workload AI assistant: it generates DAX inside Power BI, writes PySpark inside notebooks, and builds pipelines inside Data Factory. Fabric IQ operates at the platform level — it surfaces insights across workloads, assists in monitoring and exploration, detects anomalies across your Lakehouse, and powers the natural-language data exploration experience. Think of Copilot as your co-writer and Fabric IQ as your operations monitor. They share the same AI backbone, but the scope is different.
The rules I set for myself:
- Whenever Copilot offered a suggestion, I’d try it first before writing my own code
- I’d use Fabric IQ for all data quality checks instead of my manual SQL queries
- I’d let the self-healing pipeline attempt to fix failures before intervening
- I kept a daily log (a simple Markdown file in the repo)
Days 1–7: The Honeymoon
The moment I almost believed
Day 1. I opened my transformation notebook, highlighted the cell handling SCD Type 2 merges on DimCustomer, and typed: "Refactor this to handle late-arriving dimension rows, hash-based change detection on address and segment columns, and auto-expire previous records using surrogate key lookups."
That’s a non-trivial ask. SCD Type 2 logic with late-arriving facts is one of those things I’ve rewritten four times in three years, and every version has subtle bugs around edge cases — like what happens when a customer’s region changes and a transaction arrives for the old region on the same batch date.
Copilot generated 38 lines of PySpark. It used sha2 hashing on the change-detection columns, handled the surrogate key lookup via a left anti join to identify new vs. changed rows, and correctly set effective_end_date = current_date - 1 on expired records before inserting the new version. The only issue: it defaulted to current_timestamp() instead of the batch date column I use for auditability. One-line fix.
Time saved: ~45 minutes of writing and testing merge logic.
Okay. That got my attention.
Fabric IQ finds what I missed
Day 3. I asked Fabric IQ to scan my Lakehouse bronze tables for anomalies. I expected it to find nothing — this pipeline had been running for months.
It found something.
Specifically, it flagged that RegionKey in my FactSales table had 847 values that didn't match any key in DimRegion. These were orphaned foreign keys — the kind of issue I'd written about in my data model rebuild post. They'd been sitting there since a source system migration two months earlier.
Nobody noticed because the Power BI report used INNER JOIN logic on the semantic model side, which silently excluded those rows. Fabric IQ caught it in 11 seconds.
Verdict for Week 1: Genuinely impressive. If this was all Copilot and Fabric IQ did, it would be worth enabling.

What actually worked in Week 1

Days 8–20: Where the Cracks Appeared
The hallucinated DAX measure
Day 9. My semantic model uses Calculation Groups for time intelligence — a single Time Calc group that handles YoY, YTD, QoQ, and rolling averages across all measures. It's the standard pattern for any model with 40+ measures: define the logic once, apply it everywhere.
I asked Copilot for Power BI to create a “Revenue excluding internal test accounts, compatible with the existing Time Calculation Group.”
It generated this:
Revenue Excl Test =
VAR CurrentRevenue =
    CALCULATE(
        [Total Revenue],
        DATEADD(DimDate[Date], -1, YEAR)
    )
RETURN
    CALCULATE(
        CurrentRevenue,
        DimCustomer[AccountType] = "INTERNAL_QA"
    )
Three problems:
- It hardcoded DATEADD directly into the measure — completely ignoring the Calculation Group that already handles time intelligence. This creates conflicting time logic: when a user selects "YoY" from the Calc Group slicer, this measure would double-apply the year offset.
- It referenced AccountType — which doesn't exist in my model. The actual column is CustomerSegment. Copilot invented a plausible-sounding column name with correct syntax wrapping a nonexistent reference.
- It ignored my Row-Level Security (RLS) design. My model has an RLS rule filtering DimRegion by the user's assigned territory. The CALCULATE + ALL pattern Copilot almost always reaches for can produce results that conflict with intended RLS filtering depending on model design. RLS is still enforced at query time — this isn't a security breach — but a deployed measure using ALL(DimRegion) could surface aggregated data that the RLS was designed to scope, creating confusion for end users who expect territory-filtered numbers.
This is what scares me about Copilot for DAX in 2026: it handles simple measures well, but the moment your model has Calculation Groups, RLS, or complex filter propagation, it generates code that’s syntactically valid but semantically broken. And the breakage is subtle — numbers that look plausible but are quietly wrong.
The self-healing pipeline that deleted my data
Day 14. The real test.
One of my source SQL databases pushed a schema change — a column renamed from CustRegion to CustomerRegion. My Data Factory ingestion pipeline failed immediately. The self-healing feature kicked in at the ingestion layer and correctly remapped the column in the Copy Activity's JSON mapping definition. That part worked perfectly.
But the schema change cascaded downstream. My PySpark transformation notebook referenced CustRegion in three cells. The self-healing engine — now operating at the transformation layer — attempted to auto-patch the notebook. Here's where it went wrong:
- ✅ It correctly identified all three column references that needed updating
- ✅ It renamed CustRegion → CustomerRegion in cells 2 and 3
- ❌ In cell 1, which handles the SCD Type 2 merge, the AI interpreted the schema change as a signal that the source had migrated to a “deduplicated” model. It added a dropDuplicates(['CustomerID', 'OrderDate']) before the merge logic, treating it as a "defensive optimization"
- ❌ That dedup silently dropped 12,247 rows — legitimate repeat purchases from the same customer on the same date (think: a customer ordering office supplies in the morning and afternoon)

The pipeline ran green. The dashboard updated. The numbers looked normal — slightly lower, but within plausible range. If I hadn’t been watching the daily log, I would have missed it entirely.
The lesson: AI self-healing in 2026 handles metadata remapping well — renaming columns, updating connection strings, refreshing tokens. But the moment it crosses into transformation logic — inferring business rules from schema changes — it’s guessing. And its guesses are aggressive. The technology has matured significantly since 2024, but “healed” still doesn’t mean “understood.”
I set it back to detect-and-alert mode. It stays there.
Copilot’s debugging loop from hell
Day 17. A Spark notebook cell started timing out on what used to be a 90-second join. The job wasn’t failing — it was running for 40+ minutes and then dying with an OutOfMemoryError on one executor. Classic data skew in a shuffled join, caused by a highly skewed CustomerID distribution in a left join on transactional data: one enterprise customer had 380,000 transactions while the median was ~200, so that single partition was choking the executor.
I asked Copilot to diagnose it.
- Attempt 1: It suggested increasing spark.executor.memory. That's treating the symptom, not the cause — and on Fabric's managed capacity, memory isn't yours to throw around freely.
- Attempt 2: I pushed back with the partition stats. It suggested a repartition(200) before the join. That redistributes data but doesn't fix the skew — the same fat key ends up in one partition regardless.
- Attempt 3: It suggested rewriting the join as a broadcast join. The dimension table was 4.2 GB — well above the broadcast threshold. It would have crashed immediately.
- Attempt 4: I gave up and fixed it myself with a salted join key in 12 minutes: concat a random integer modulo to the skewed key, pre-explode the dimension side, join on the salted key, then aggregate back.
Total time wasted following Copilot’s suggestions: ~35 minutes. The issue was well-documented in Spark performance guides. Copilot just couldn’t reason through why the job was slow — it only knew how to pattern-match against common error messages.

The pattern I noticed
By Day 20, I had a clear theory: Copilot is excellent at generating code from clear specs, and terrible at diagnosing problems in existing systems. Generation and diagnosis are fundamentally different tasks. Generating SCD Type 2 logic from a natural-language spec? It knows the patterns. Diagnosing why a Spark join is skewing across executors? That requires understanding data distribution, partition strategy, and the specific shape of your data — none of which Copilot has access to.
The same applies to DAX. Copilot can write a clean CALCULATE + DATEADD from scratch. It cannot understand that your model already has a Calculation Group handling time intelligence, or that your RLS roles impose filter context it needs to preserve. It generates in a vacuum.
Fabric IQ, meanwhile, stayed consistently good at what it does — monitoring, anomaly detection, schema drift alerts. It never overstepped. It never tried to “fix” things autonomously. That restraint turned out to be its best feature.
Days 21–30: Finding the Equilibrium
By the third week, I stopped fighting the tools and started designing around their strengths.
The framework I landed on
Copilot owns: Boilerplate generation. First drafts of PySpark transformations from clear natural-language specs. Cell documentation. Starter DAX measures (always reviewed before publishing).
Fabric IQ owns: Data quality monitoring. Anomaly alerts. Schema drift detection. Natural language exploration of Lakehouse tables for ad-hoc questions from stakeholders.
I own: All business logic. All debugging. All DAX filter context. All pipeline orchestration decisions. All “does this number make sense?” gut checks.

What changed in my workflow
Before this experiment, my Monday morning looked like this:
- Open pipeline monitoring → check for failures (15 min)
- Run data quality SQL queries manually (30 min)
- Check dashboard for visual anomalies (15 min)
- Begin ad-hoc analysis or report updates (rest of morning)
After 30 days:
- Check Fabric IQ alerts (5 min — it flags issues proactively)
- Review any self-healing actions in log (10 min — I keep it in monitor mode, not auto-fix)
- Open dashboard (10 min — now I focus on logic validation, not visual checks)
- Use Copilot for any new transformation code needed (time varies — usually 30–50% faster on generation tasks)

Net time saved per week: ~3 hours. Not the revolution vendors promise. But real. Consistent. Compounding.
The Honest Scorecard

What I’d Tell Another Analyst With 3 Years of Experience
Enable Copilot and Fabric IQ. They’re worth it. But set your expectations:
1. Copilot is a fast intern, not a senior analyst. It generates code quickly and correctly from clear instructions. It cannot debug, it cannot understand your business context, and it will confidently hallucinate column names. Treat its output like a pull request from someone who joined the team yesterday — review everything.
2. Fabric IQ is the monitoring tool you should have built but never did. Honest truth: most of us don’t write proper data quality checks. We should. We don’t. Fabric IQ fills that gap immediately and well. If you do nothing else, enable Fabric IQ and let it scan your Lakehouse weekly.
3. Self-healing pipelines are production-ready for metadata — not for logic. The detection and metadata remapping (column renames, connection string updates, token refreshes) have matured enormously — that part is genuinely GA-quality in 2026. But the moment self-healing crosses into transformation logic — inferring business rules, adding optimizations, modifying notebook code — it’s still guessing. Use detect-and-alert mode for anything beyond metadata. Log everything.
4. The real ROI isn’t speed — it’s cognitive load. I didn’t save massive hours. I saved decision fatigue. Knowing that Fabric IQ would catch schema drift meant I stopped context-switching to check for it manually. Knowing Copilot could draft boilerplate meant I spent more energy on logic and less on syntax. That mental clarity is harder to measure but arguably more valuable.
The Cost Question Nobody Talks About
Here’s what the “AI saves you 3 hours” narrative leaves out: Copilot and Fabric IQ consume Capacity Units (CUs).
I’m on an F4 SKU. During the 30-day test, my CU consumption increased by roughly 15–20% compared to the prior month — in my specific usage pattern, with my scan frequency and notebook interaction volume. That’s not catastrophic — but it’s not free. On my SKU and region, that translated to approximately $30–$50/month in additional capacity burn. Your numbers will vary depending on SKU size, region pricing, and how aggressively you use Copilot and Fabric IQ.
The math: ~3 hours saved per week × 4 weeks = 12 hours. At my billing rate, that time is worth significantly more than $50. The ROI is clearly positive — but only if you’re actually using the time saved productively. If you enable Copilot and Fabric IQ and then spend those 3 hours scrolling LinkedIn, the CU bill is just a tax on nothing.
For teams on larger F-SKUs (F64+), the CU overhead is proportionally smaller and barely noticeable. For smaller SKUs (F2, F4), watch your Capacity Metrics app — especially if you’re running Fabric IQ scans on a schedule.
The Security Question I Should’ve Asked Earlier
One thing I didn’t test until Day 22 — and should have tested on Day 1: does Copilot respect Workspace permissions and RLS boundaries?
Short answer: mostly yes, with one caveat.
Copilot in Notebooks operates within your Workspace permissions. It can’t access Lakehouses or Warehouses you don’t have rights to. Fabric IQ similarly respects OneLake security boundaries — it only scans tables your identity has access to.
The caveat: when Copilot generates DAX, it doesn’t inherently know about your RLS roles. As I found on Day 9, it can suggest CALCULATE + ALL patterns that produce results conflicting with intended RLS filtering, depending on your model design. It's not a security breach — RLS is still enforced at query time — but a deployed measure using ALL(DimRegion) could surface aggregated numbers that the RLS was designed to scope, confusing end users who expect territory-filtered views.
My recommendation: if your semantic model uses RLS, add “Do not use ALL() on any RLS-filtered dimension” to your Copilot prompt as a constraint. It won’t always listen, but it reduces the failure rate significantly.
I Trusted Fabric Copilot and Fabric IQ With My Production Pipeline for 30 Days — Here’s the Honest… was originally published in Towards AI on Medium, where people are continuing the conversation by highlighting and responding to this story.